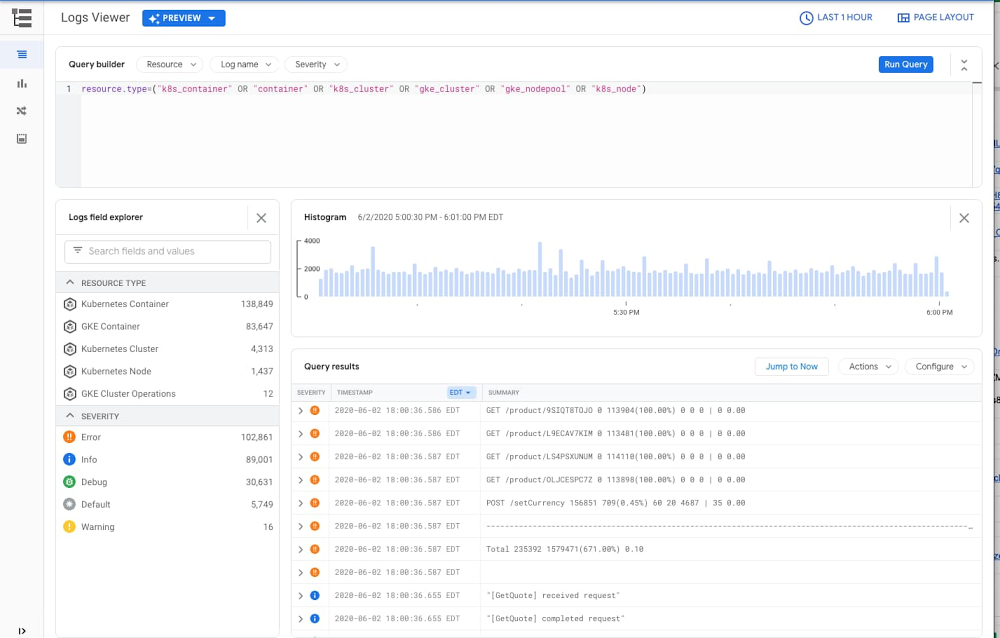
Logs are an important part of troubleshooting and it’s critical to have them when you need them. When it comes to logging, Google Kubernetes Engine (GKE) is integrated with Google Cloud’s Logging service. But perhaps you’ve never investigated your GKE logs, or Cloud Logging? Here’s an overview of how logging works in GKE, and how to configure, find, and interact effectively with the GKE logs stored in Cloud Logging.How your GKE logs get to Cloud LoggingAny containerized code that is running in a GKE cluster—either your code or pre-packaged software—typically generates a variety of logs. These logs are usually written to standard output (‘stdout’) and standard error ‘stderr’, and include error, informational and debugging messages. When you set up a new GKE cluster in Google Cloud, system and app logs are enabled by default. A dedicated agent is automatically deployed and managed on the GKE node to collect logs, add helpful metadata about the container, pod and cluster and then send the logs to Cloud Logging. Both system logs and your app logs are then ingested and stored in Cloud Logging, with no additional configuration needed. Find your GKE logs in Cloud LoggingIn order to find these logs in the Cloud Logging service, all you need to do is filter your logs by GKE-related Kubernetes resources, by clicking this link, or by running the following query in the log viewer: resource.type=(“k8s_container” OR “container” OR “k8s_cluster” OR “gke_cluster” OR “gke_nodepool” OR “k8s_node”)This query surfaces logs that are related to Kubernetes resources in GKE: clusters, nodes, pods and containers. Alternatively, you can access any of your workloads in your GKE cluster and click on the container logs links in your deployment, pod or container details; this also brings you directly to your logs in the Cloud Logging console.If no log entries return with your query, it’s time to look for reasons your logs aren’t being generated or collected into Cloud Logging. Make sure you’re collecting GKE logsAs mentioned above, when you create a GKE cluster, system and app logs are set to be collected by default. You can update how you configure log collection either when you create the cluster or by updating the cluster configuration. If you don’t see any of your logs in Cloud Logging, check whether the GKE integration with Cloud Logging is properly enabled. Follow these instructions to check the status of your cluster’s configuration.If the GKE integration is not enabled, you can enable log collection for the cluster by editing the cluster in the Google Cloud Console, or by using the gcloud container clusters update command line.If you have already enabled the GKE integration with Cloud Logging and Cloud Monitoring and still don’t see any of your GKE logs, check whether your logs they’ve been excluded. Logging exclusions may have been added to exclude logs from ingestion into Cloud Logging either for all or specific GKE logs. Adjusting these exclusions allows you to ingest the GKE logs that you need into Cloud Logging. Beginning with GKE version 1.15.7, you can configure a GKE cluster to only capture system logs. If you have already enabled the GKE integration with Cloud Logging and Cloud Monitoring and only see system logs in Cloud Logging, check whether you have selected this option. To check whether application log collection is enabled or disabled, and to then enable app log collection, follow these instructions. Make your GKE logs more effectiveHaving structured logs can help you create more effective queries. With Cloud Logging, structuring your logs means it parses your JSON object which makes it easier to build queries for your application JSON messages. GKE automatically adds structure to its log messages if your logs contain JSON objects in the log message. As a developer, you can also add specific elements in your JSON object that Cloud Logging will automatically map to the corresponding fields when stored in Cloud Logging. This may be useful to set the severity, traceId or labels for your log messages.Using traces in conjunction with log messages is another common practice to monitor and maintain the health and performance of your app. Traces offer valuable context for every transaction in your application and thus make the troubleshooting effort significantly more effective, especially in distributed applications. If you use Cloud Trace (or any other tracing solution) to monitor distributed application tracing, another way to make your logs more useful is to include the trace id in the log message. With this connection, you can link to Cloud Trace directly from your log messages when you’re troubleshooting your app.Reduce your GKE log usage GKE produces both system and application logs. While useful, sometimes the volume of logs may be higher than you expected. For example, certain log messages generated by Kubernetes such as the kublet logs on the node can be quite chatty and repetitive. These logs can be useful if you’re operating a production cluster for troubleshooting purposes, but may not be as useful in a purely development environment. If you feel you have too many logs, you can use Logging exclusions along with a specific filter to exclude log messages that you may not use. But be thoughtful about excluding logs, since you often won’t need the logs until later when you are for troubleshooting a problem. Excluding some repetitive logs (or excluding a certain percentage of them) can reduce the noise. Kubernetes produces many different kinds of logs and Cloud Logging can help you to make sense of them. For more details about using Cloud Logging with your GKE apps, check out our blog post.
Quelle: Google Cloud Platform

Published by