Bare Metal Solution: new regions, new servers, and new certifications

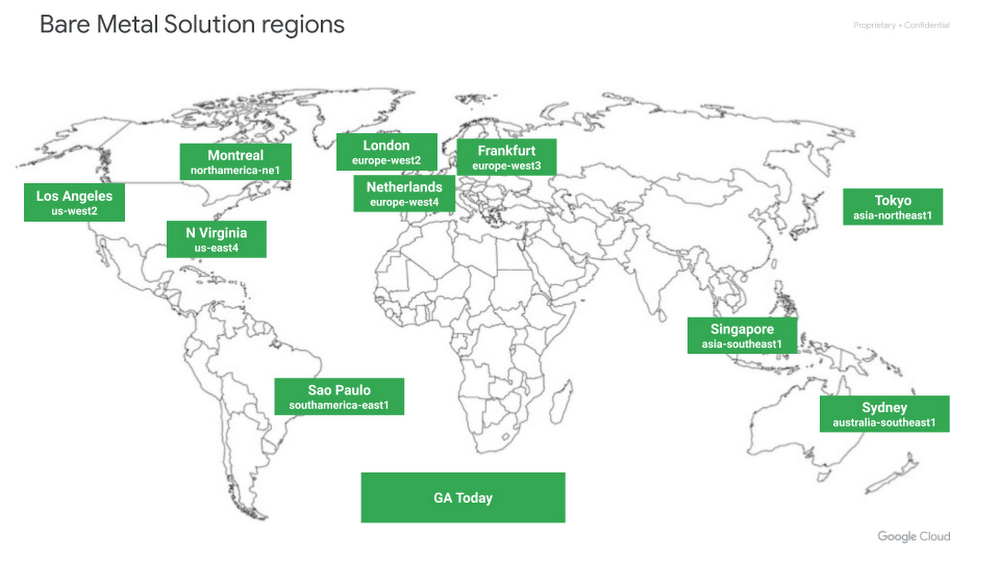
Not a lot of things are certain in 2021, but one thing you can count on is Google Cloud’s commitment to our customers and to being a leader in open cloud. Supporting multiple workloads and meeting customers where they are is part of that open cloud commitment—and so is Bare Metal Solution, our solution to run Oracle database workloads on Google Cloud. As we continue developing Bare Metal Solution to meet your needs and meet you where you are, we’re announcing three Bare Metal Solution enhancements: Availability in Montreal, our 10th region;A new, smaller 8-core server; Support for PCI DSS and HIPAA. In 2021, we’ll continue to build on the momentum of Google Cloud’s Bare Metal Solution, which enables businesses to run Oracle databases close to Google Cloud with extremely low latency. See how StubHub is using Bare Metal Solution to reduce their dependency on Oracle, lower overall costs, and improve performance.Related ArticleBare Metal Solution: Coming to a Google Cloud data center near youWith Bare Metal Solution, now you can run specialized databases in five new Google Cloud regions.Read ArticleNew regions, to meet you where you areLast year, we launched Bare Metal Solution in five regions and added four more throughout the year. With the launch of Bare Metal Solution in Montreal today, we’re kicking off this year by bringing Bare Metal Solution to Canada to provide our customers with local availability. We’ll launch Bare Metal Solution in a slew of other new regions in 2021 (and even some dual region availability). We recognize the need for local options for our customers, so please reach out to your sales rep if you’re interested in Bare Metal Solution, and we can work to get you on our roadmap. Below, in green, are our 10 GA regions:A smaller server, to help you save on licensing and hardware costsIn order to help you right-size your workloads and reduce costs, we’ve added a new, smaller 8-core server to our lineup in all of our regions. This new 8-core server, which leverages our state-of-the-art compute, storage, and networking, means a migration to Bare Metal Solution can help shrink your hardware footprint and thus potentially reduce Oracle licensing costs, which are often dependent on core count. Here’s our full lineup of Bare Metal Servers, available in all of our regions:PCI DSS and HIPAA, to support your enterprise workloadLast, but not least, Bare Metal Solution can now help support customer compliance with PCI DSS and HIPAA. Support for PCI DSS will allow our retail partners to bring their customers’ credit card data and run their workloads according to the Payment Card Industry Data Security Standards (PCI DSS). Support for HIPAA similarly means our healthcare partners can bring their customers’ healthcare data and run their workloads according to the requirements of the Health Insurance Portability and Accountability Act (HIPAA). As we expand to new regions and work to better enable specific industries, you can expect future announcements of both regional and industry-related certifications.
Quelle: Google Cloud Platform

How Cloud Storage delivers 11 nines of durability—and how you can help

One of the most fundamental aspects of any storage solution is durability—how well is your data protected from loss or corruption? And that can feel especially important for a cloud environment. Cloud Storage has been designed for at least 99.999999999% annual durability, or 11 nines. That means that even with one billion objects, you would likely go a hundred years without losing a single one! We take achieving our durability targets very seriously. In this post, we’ll explore the top ways we protect Cloud Storage data. At the same time, data protection is ultimately a shared responsibility (the most common cause of data loss is accidental deletion by a user or storage administrator), so we’ll provide best practices to help protect your data against risks like natural disasters and user errors.Physical durabilityMost people think about durability in the context of protecting against network, server, and storage hardware failures.At Google, our philosophy is that software is ultimately the best way to protect against hardware failures. This allows us to attain higher reliability at an attractive cost, instead of depending on exotic hardware solutions. We assume hardware will fail all the time—because it does! But that doesn’t mean durability has to suffer.To store an object in Cloud Storage, we break it up into a number of ‘data chunks’, which we place on different servers with different power sources. We also create a number of ‘code chunks’ for redundancy. In the event of a hardware failure (e.g., server, disk), we use data and code chunks to reconstruct the entire object. This technique is called erasure coding. In addition, we store several copies of the metadata needed to find and read the object, so that if one or more metadata servers fails, we can continue to access the object.The key requirement here is that we always store data redundantly across multiple availability zones before a write is acknowledged as successful. The encodings we use provide sufficient redundancy to support a target of more than 11 nines of durability against a hardware failure. Once stored, we regularly verify checksums to guard data at rest from certain types of data errors. In the case of a checksum mismatch, data is automatically repaired using the redundancy present in our encodings.Best practice: use dual-region or multi-region locationsThese layers of protection against physical durability risks are well and good, but they may not protect against substantial physical destruction of a region—think acts of war, an asteroid hit, or other large-scale disasters.Cloud Storage’s 11 nines durability target applies to a single region. To go further and protect against natural disasters that could wipe out an entire region, consider storing your most important data in dual-region or multi-region buckets. These buckets automatically ensure redundancy of your data across geographic regions. Using these buckets requires no additional configuration or API changes to your applications, while providing added durability against very rare, but potentially catastrophic, events. As an added benefit, these location types also come with significantly higher availability SLAs, because we can transparently serve your objects from more than one location if a region is temporarily inaccessible.Durability in transitAnother class of durability risks concerns corruption to data in transit. This could be data transferred across networks within the Cloud Storage service itself or when uploading or downloading objects to/from Cloud Storage.To protect against this source of corruption, data in transit within Cloud Storage is designed to be always checksum-protected, without exception. In the case of a checksum-validation error, the request is automatically retried, or an error is returned, depending on the circumstances.Best practice: use checksums for uploads and downloadsWhile Google Cloud checksums all Cloud Storage objects that travel within our service, to achieve end-to-end protection, we recommend that you provide checksums when you upload your data to Cloud Storage, and validate these checksums on the client when you download an object.Human-induced durability risksArguably the biggest risk of data loss is due to human error—not only errors made by us as developers and operators of the service, but also errors made by Cloud Storage users!Software bugs are potentially the single biggest risk to data durability. To avoid durability loss from software bugs, we take steps to avoid introducing data-corrupting or data-erasing bugs in the first place. We then maintain safeguards to detect these types of bugs quickly, with the aim of catching them before durability degradation turns into durability loss.To catch bugs up front, we only release a new version of Cloud Storage to production after it passes a large set of integration tests. These include exercising a variety of edge-case failure scenarios such as an availability zone going down, and comparing the behaviors of data encoding and placement APIs to previous versions to screen for regressions.Once a new software release is approved, we roll out upgrades in stages by availability zone, starting with a very limited initial area of impact and slowly ramping up until it is in widespread use. This allows us to catch issues before they have a large impact and while there are still additional copies of data (or a sufficient number of erasure code chunks) from which to recover, if needed. These software rollouts are monitored closely with plans in place for quick rollbacks, if necessary.There’s a lot you can do, too, to protect your data from being lost.Best practice: turn on object versioningOne of the most common sources of data loss is accidental deletion of data by a storage administrator or end-user. When you turn on object versioning, Cloud Storage preserves deleted objects in case you need to restore them at a later time. By configuring Object Lifecycle Management policies, you can limit how long you keep versioned objects before they are permanently deleted in order to better control your storage costs.Best practice: back up your dataCloud Storage’s 11-nines durability target does not obviate the need to back up your data. For example, consider what a malicious hacker might do if they obtained access to your Cloud Storage account. Depending on your goals, a backup may be a second data copy in another region or cloud, on-premises, or even physically isolated with an air gap on tape or disk.Best practice: use data access retention policies and audit logsFor long-term data retention, use the Cloud Storage bucket lock feature to set data retention policies and ensure data is locked for specific periods of time. Doing so prevents accidental modification/deletion, and when combined with data access audit logging, can satisfyregulatory and compliance requirements such as FINRA, SEC, and CFTC and certain health care industry retention regulationsBest practice: use role-based access control policiesYou can limit the blast radius of malicious hackers and accidental deletions by ensuring that IAM data access control policies follow the principles of separation of duties and least privilege. For example, separate those with the ability to create buckets from those who can delete projects.Encryption keys and durabilityAll Cloud Storage data is designed to always be encrypted at rest and in transit within the cloud. Because objects are unreadable without their encryption keys, the loss of encryption keys is a significant risk to durability—after all, what use is highly durable data if you can’t read it? With Cloud Storage, you have three choices for key management: 1) trust Google to manage the encryption keys for you, 2) use Customer Managed Encryption Keys (CMEK) with Cloud KMS, or 3) use Customer Supplied Encryption Keys (CSEK) with an external key server.Google takes similar steps as described earlier (including erasure coding and consistency checking) to protect the durability of the encryption keys under its control.Best practice: safeguard your encryption keysBy choosing either CMEK or CSEK to manage your keys, you take direct control of managing your own keys. It is vital in these cases that you also protect your keys in a manner that also provides at least 11 nines of durability. For CSEK, this means maintaining off-site backups of your keys so that you have a path to recovery even if your keys are lost or corrupted in some way. If such precautions are not taken, the durability of the encryption keys will determine the durability of the data.Going beyond 11 ninesGoogle Cloud takes the responsibility of protecting your data extremely seriously. In practice, the numerous techniques outlined here have allowed Cloud Storage to exceed 11 nines of annual durability to date. Add to that the best practices we shared in this guide, and you’ll help to ensure that your data is here when you need it—whether that be later today or decades in the future. To get started, check out this comprehensive collection of Cloud Storage how-to guides.Thanks to Dean Hildebrand, Technical Director, Office of the CTO, who is a coauthor of the document on which this post is based.
Quelle: Google Cloud Platform

How leading enterprises use API analytics to make effective decisions

Our “State of the API Economy 2021” report indicates that despite the many financial pressures and disruptions wrought by COVID-19, 75% of companies continued focusing on their digital transformation initiatives, and almost two-thirds of those companies actually increased their investments and efforts.Because APIs are how software talks to software and how developers leverage data and functionality in different systems, they are at the center of these digital transformation initiatives. As organizations across the world have shifted how they do business, IT organizations have scrambled to meet demands for new applications—and to do more with APIs.  API analytics usage is seeing an explosive growthLeading businesses use API analytics to not only inform new strategies but also align leadership goals and outcomes. Because executive sponsors tend to support initiatives that produce tangible results, teams can use API metrics to unite leaders around digital strategies and justify continued platform-level funding for the API program. This demand is responsible for surging API analytics usage. Among Apigee customers, API analytics adoption increased by 75% from 2019 to 2020—growth that reflects organizations’ broader need to holistically assess the business and digital transformation impacts of API programs.API analytics point to opportunities To remain competitive in today’s hyper-connected world, one key question needs to be answered: “How do we drive impact with our digital initiatives while also making sure we’re putting our limited resources to the best use?“ API analytics support API providers in this endeavor by helping them to determine which digital assets are key drivers of business value and to create a strategic view of digital interactions. By tracking which APIs are being consumed by certain communities of developers, which APIs are powering the most popular apps, and how performant APIs are, organizations can understand which digital assets need optimization or iteration, which digital assets are being leveraged for new uses or by new communities, which digital assets are driving revenue, and more. Beyond helping enterprises answer questions they’ve already identified, API analytics also surface patterns that may be unexpected—and that help both IT and business leaders refine the KPIs they use analytics to generate. If an API becomes popular with developers in a new vertical for example, that may persuade the enterprise to focus on KPIs like adoption among these specific developers, rather than on overall adoption.  Best Practices for defining effective API metricsWhen our survey respondents were asked how API usage at their company is currently measured, top responses included metrics focused on API performance (35%), on traditional IT-centric numbers (22%), and on consumption of APIs (21%). But when asked about preference for API measurement, business impact topped the list (43%). The data suggests that API effectiveness metrics vary across geography and industry, with measurement by business impact or API performance serving as a collective north star.Establishing a framework to connect digital investments directly to metrics and key performance indicators (KPIs) is among the most important areas of strategic alignment for ensuring a successful API strategy. Successful programs clearly define and measure a combination of business metrics, such as direct or indirect revenue, and API consumption metrics, such as API traffic, the number of apps built atop given APIs, and the number of active developers leveraging APIs. Good KPIs are a cornerstone of an effective API analytics effort, but they can be difficult to define. Here are some effective KPIs to help position an API program for success.Operational KPIsAverage and max call latency: P1 latency, or elapsed time, is an important metric that impacts customer experiences. Breaking down this KPI into detailed metrics (e.g., networking times, server process and upload and download speeds) can help provide additional insights for measuring the performance of APIs–and thus of the apps that rely on them.Total pass and error rates: Measuring success rates in terms of the number of API calls that trigger non-200 status codes can help organizations to track how buggy or error-prone an API is. In order to track total pass and error rates, it’s important to understand what type of errors are surfacing during API usage.API SLA: While one of the most basic metrics, API Service Level Agreements (SLA) is the gold standard for measuring the availability of a service. Many enterprise SLAs leave software providers little-to-no room for error. Providing this level of service means a provider’s upstream APIs need to be running–and that requires API monitoring and analytics to maintain performance and quickly troubleshoot any problems.  Adoption KPIsDevelopers: This target is commonly intended to improve API adoption. Enterprises should consider using this metric in combination with other metrics that confirm a given API’s business utility.Onboarding: The portal that application developers use to access APIs should ideally feature an automated approval process, including self-service onboarding capabilities that let users register their apps, obtain keys, access dashboards, discover APIs, and so on. The ease and speed with which developers can navigate this process can significantly impact the adoption of an enterprise’s API program. Just as consumers are unlikely to adopt a service if too much friction is involved, developers are less likely to adopt APIs that cannot be easily and securely accessed. API traffic: This target can help API programs develop a strong DevOps culture by continuously monitoring, improving, and driving value through APIs. Enterprises should consider coupling this target with related metrics up and down the value chain, including reliability and scalability of back-ends.API product adoption: Retention and churn can identify key patterns in API adoption. A product with high retention is closer to finding its market fit than a product with a churn issue, for example. Unlike subscription retention, product retention tracks the actual usage of a product such as an API. Business Impact KPIsDirect and indirect revenue: These targets track the different ways APIs contribute to revenue. Some APIs provide access to particularly rare and valuable datasets or particularly useful and hard-to-replicate functionality—and in these cases, enterprises sometimes directly monetize APIs, offering them to partners and external developers as paid services/products. Often, however, an API can generate more value if enterprises focus on adoption rather than upfront revenue. A retailer won’t make much money charging partners for access to a store locator API, for example, but if they make the API freely available, partners are more likely to use it to add functionality to their apps and the retailer is more likely to benefit because its business is exposed to more people through more digital experiences. It is important to be able to track both direct revenue from monetized APIs and forms of indirect value, such as how adoption of an API among certain developers supports those developers’ revenue-generating apps. Likewise, it is important to be able to adjust pricing models to find the right blend; analytics can reveal, for example, whether an API is most valuable if offered for free, if offered for a flat subscription rate, or if offered in a “freemium” model with free base access and paid tiers. Partners: This target can be used to accelerate partner outreach, drive adoption, and demonstrate success to existing business units.Cost: Enterprises can reduce costs by reusing APIs rather than initiating new custom integration efforts for each new project. When internal developers use standardized APIs to connect to existing data and services, the APIs become digital assets that can be leveraged again and again for new use cases, typically with little if any overhead costs. By tracking API usage, enterprises can identify instances in which expense that otherwise would have gone to new integration projects has been eliminated thanks to reusable APIs. Likewise, because APIs automate and accelerate many processes, enterprises can identify how specific APIs contribute to faster development cycles and faster completion of business processes–and how many resources are saved in the process.  API analytics is at the core of successful API programsComprehensive monitoring and robust analytics efforts for API programs are among the most important ways to make data-driven business decisions. For an enterprise unsure how to scale its API program or uncertain about which next steps to take, analytics may literally be the difference-maker, providing insights that illuminate previously hidden opportunities, remove ambiguity, drive consensus, and help the business grow.Citrix is among the Google Cloud customers using Apigee’s monitoring and analytics solutions to proactively monitor the performance, availability, and security health of their APIs. “Apigee has a lot of built-in analytics that run automatically on every API, and Citrix can track any custom metric it wants. We’re gaining real-time visibility into our APIs, and that is helping us grow a strong API program for both internal and external developers.” says Adam Brancato, senior manager of customer apps at Citrix. When monitoring and analytics tools are integrated directly, rather than bolted on, the platform managing APIs is the same platform capturing data—which means the data can be acted on more easily and in near-real time. A full lifecycle API management solution such as Apigee provides near real-time monitoring and analytics insights that enable API teams to measure the health, usage, and adoption of their API, while also offering the ability to diagnose and resolve problems faster. The solution also enables teams to keep abreast of all essential aspects of their API-powered digital business.Want to learn more? The “State of API Economy 2021*” report describes how digital transformation initiatives evolved throughout 2020, as well as where they’re headed in the years to come. Read the full report*This report is based on Google Cloud’s Apigee API Management Platform usage data, Apigee customer case studies, and analysis of several third-party surveys conducted with technology leaders from enterprises with 1,500 or more employees, across the United States, United Kingdom, Germany, France, South Korea, Indonesia, Australia, and New Zealand.Related ArticleTop 5 trends for API-powered digital transformation in 2021Google Cloud’s State of APIs report investigates digital transformation in 2020 and where trends point in 2021 and beyond.Read Article
Quelle: Google Cloud Platform

Introducing Sqlcommenter: An open source ORM auto-instrumentation library

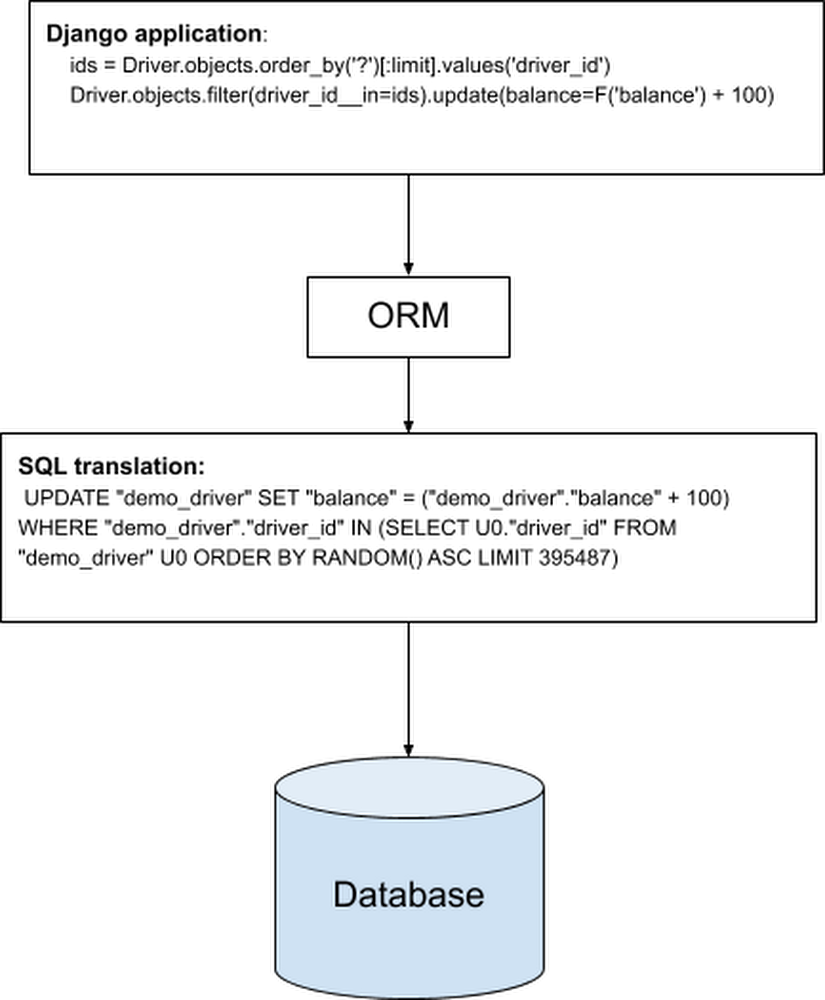
Object-relational mapping(ORM) helps developers to write queries using an object-oriented paradigm, which integrates naturally with application code in their preferred programming language. Many full-stack developers rely on ORM tools to write database code in their applications,  but since the SQL statements are generated by the ORM libraries, it can be harder for application developers to understand the application code resulting in slow query. The following example shows a snippet of code where 2 lines of Django application code are translated by an ORM library to a single SQL statement.Introducing SqlcommenterToday, we are introducing Sqlcommenter, an open source library that addresses the gap between the ORM libraries and understanding database performance. Sqlcommenter gives application developers visibility into which application code is generating slow queries and maps application traces to database query plans.Sqlcommenter is an open source library that enables ORMs to augment SQL statements before execution, with comments containing information about the code that caused its execution. This helps in easily correlating slow queries with source code and giving insights into backend database performance. In short, it provides observability into the state of client-side applications and their impact on database performance. Application developers need to do very little application code change to enable Sqlcommenter for their applications using ORMs. Observability information from Sqlcommenter can be used by application developers directly using slow query logs, or it can be integrated into other products or tools, such as Cloud SQL Insights, to provide application-centric monitoring.Getting started with SqlcommenterSqlcommenter is available for Python, Java, Node.js and Ruby languages and supports Django, Sqlalchemy, Hibernate, Knex, Sequelize and Rails ORMs. Let’s go over an example of how to enable Sqlcommenter for Django and look at how it helps to analyze Django application performance. Python InstallationSqlcommenter middleware for Django can be installed using the pip3 command.pip3 install –user google-cloud-sqlcommenterEnabling Sqlcommenter for DjangoTo enable Sqlcommenter in a Django application, you can edit your settings.py file to include google.cloud.sqlcommenter.django.middleware.SqlCommenter in the MIDDLEWARE section:Augment slow query logs with ORM informationSlow query logs provided by databases like PostgreSQL and MySQL help in finding and troubleshooting slow running queries. For example, in PostgreSQL, you can set the log_min_duration_statement database flag, and PostgreSQL will log the queries where the  duration is equal or greater than the value specified in log_min_duration_statement.  By augmenting slow query logs with application tags from the ORM, Sqlcommenter helps developers determine what application code is associated with a slow query. Here is an example of a query log from a PostgreSQL database that is used by a Django application with Sqlcommenter for Django enabled.In the above log, you can see an UPDATE statement being executed. At the end of the SQL statement, SQL style comments have been added in the form of key=value pairs, and we call the keys application tags.This comment is added by Sqlcommenter to the SQL query that was generated by the Django ORM.As you can see from the comments, it provides information about the controller, which in this example is “assign_order.” This is the controller method that sent the query. In the case of Django, the Controller in an MVC pattern maps to the View in a Django application. It also provides information about the Route through which this View in Django was called. Using this information, application developers can immediately relate which View method created this query. Since this query has taken 400 msec, an application developer can reason why this query created by the “assign_order” View method is expensive.Trace ORMs with OpenTelemetry integrationSqlcommenter allows OpenCensus and OpenTelemetry trace context information to be propagated to the database, enabling correlation between application traces and database query plans.The following example shows a query log with SQL comments added by Sqlcommenter for the Sequelize ORM.From the example query log above, you can see traceparent tags as part of the comment. The traceparent application tag is based on W3C Trace Context, which defines the standard for trace context propagation with trace id and span id. The traceparent application tag is created by Sqlcommenter using the context. Using the query log and traces from applications, application developers can relate their traces to a specific query. For more information on Context and Trace propagation, please see the OpenTelemetry specification. Application-centric monitoring with Cloud SQL Insights with the help of SqlcommenterLet us look at how the recently launched Cloud SQL Insights integrated with Sqlcommenter to help developers quickly understand and resolve query performance issues on Cloud SQL. Cloud SQL Insights helps you detect and diagnose query performance problems for Cloud SQL databases. It provides self-service, intuitive monitoring, and diagnostic information that goes beyond detection to help you to identify the root cause of performance problems. You can monitor performance at an application level and trace the source of problematic queries across the application stack by model, view, controller, route, user, and host. Cloud SQL Insights uses the information sent by Sqlcommenter to identify the top application tags (controller, route, etc.) that are sent by the application. The following example is an Insights dashboard for the Cloud SQL instance connected to the Django application we saw earlier. As you can see from the table in the screenshot below, top controller and route application tags are provided along with the other metrics for the application tags. These application tags are generated by the Sqlcommenter enabled in the Django application and Cloud SQL PostgreSQL uses these tags to identify the top application tags. This information is shown in the Cloud SQL Insights dashboard and also exported to Cloud Monitoring.The “assign_order” controller, which we saw earlier, is shown along with the route “demo/assign_order” as one of the top tags that is contributing to the database load.  For more details on you can use Insights, see the Cloud SQL Insights documentation.Using end-to-end traces in Cloud SQL InsightsOne issue with using query logs with traceparent is that it’s hard to visualize the query plan and application traces. With Cloud SQL Insights, query plans are generated as Cloud Traces with the traceparent context information from the SQL comments. Since the trace id is created by the application, and the parent span id is sent to the database as SQL comments, end-to-end tracing from application to database is now possible. You can visualize the end-to-end trace with a query plan as spans in the Cloud Trace dashboard. The example below shows application trace spans from OpenTelemetry along with query plan trace spans from the NodeJS Express Sqlcommenter library .Using this information, application developers can not only know the queries created by their application code, they can relate the query plan with application traces to diagnose their application performance issues.You can access these traces in Cloud SQL Insights by selecting an item in the Top Tags table. SummarySqlcommenter provides application developers using ORM tools the ability to diagnose performance issues in their application code impacting databases. With Cloud SQL Insights’ integration with Sqlcommenter, application developers can visualize the top application tags contributing to database load as well as trace end to end application performance problems. For more information on languages and ORM support for Sqlcommenter, or if you would like to contribute to the project, please visit the Sqlcommenter github repo.
Quelle: Google Cloud Platform

At Docker, we are committed to making developer’s lives easier, and maintaining and extending our commitment to the Open Source community and open standards for many of our projects. We believe building new capabilities into the Docker Platform in partnership with our developer community and in full transparency leads to much better software.

Last December, we announced the release of a new experimental Docker Hub CLI tool, also known as hub-tool. This new CLI lets you explore, inspect and manage your content on Docker Hub as well as work with your teams and manage your account. We demonstrated it during the last Docker Community All Hands in December 2020.

This tool is already available with Docker Desktop, so if you are a Windows or Mac user you can try it now. For Linux users, we are pleased to announce that we open sourced the hub-tool code, and it can be found at https://github.com/docker/hub-tool. You can download the binary directly on the release page.

With the open sourcing of hub-tool we have also cut a new v0.3.0 release which includes the following new features:

Added an optional argument to the account info command to check the status of an organization

Added a –platform flag to the tag inspect command to inspect a specific platform if the image is a multi-arch image

Give us feedback!

This tool is still experimental, but it needs feedback from you to improve. Please let us know on the hub-tool issue tracker.

The post 🧪 Open Sourcing the Docker Hub CLI Tool appeared first on Docker Blog.
Quelle: https://blog.docker.com/feed/