Five do’s and don’ts of multicloud, according to the experts

Do you want to fire up a bunch of techies? Talk about multicloud! There is no shortage of opinions. I figured we should tackle this hot topic head-on, so I recently talked to four smart folks—Corey Quinn of Duckbill Group, Armon Dadgar of Hashicorp, Tammy Bryant Butowof Gremlin, and James Watters of VMware—about what multicloud is all about, key considerations, and why you should (or shouldn’t!) do it.Five important insights came out of these discussions. If you’re on a multicloud journey or considering one, keep reading.Do: Choose to do multicloud for the right reasonsDon’t do multicloud because Gartner says so, implores Corey Quinn. Before embarking on a multicloud, define a “why” focused on business value journey, says Armon Dadger. For example, you might want to use services from each public cloud because of their differentiated services, according to Tammy Bryant Butow. Armon also calls out regulatory reasons, existing business relationships, and accommodating mergers and acquisitions. On the topic of M&A, Corey points out that if you acquire a company that uses another cloud, it’s usually expensive and difficult to consolidate. It can be smarter to stay put.Don’t: Over-engineer for workload or data portabilityThinking that you’ll build a system that moves seamlessly among the various cloud providers? Hold up, says our group of experts. Armon points out that aspects of your toolchain or architecture may be multicloud—think of some of your workflows or global network routing—but that shifting workloads or data is far from simple. Corey says that trying to engineer for “write once, run anywhere” can slow you down, and ignores the inherent uniqueness that’s part of each platform. Specifically, Corey calls out the per-cloud stickiness of identity management, security features, and even network functionality. And data gravity is still a thing, says James, that causes some to dismiss multicloud outright.If you’re using multiple public clouds, you take advantage of the distinct value each offers, Armon says. Use native cloud services where possible so that you see the benefits from useful innovations, built-in resilience, and baked-in best practices. The value from that cloud-infused workload may outweigh the benefits of seamless portability.Do: Recognize different stakeholder interests and needsJames smartly points out that many multicloud debates happen because people are arguing from different perspectives. Context matters. If you’re an infrastructure engineer who invests heavily in a given cloud’s identity and access management model, multicloud looks tricky. Or if you’re a data engineer with petabytes of data homed in a particular cloud, multicloud may look unrealistic. James highlights that many developers default to multicloud because their local tools—where all the work happens—are multicloud. A developer’s IDE and preferred code framework(s) aren’t tied to any given cloud. Be aware that groups within your organization will come at multicloud from distinct directions. And this may impact your approach!Don’t: Go it aloneCorey talks about the importance of asking others what worked, and what didn’t. Tammy offers her best practices around sharing results from experiments. It’s about sharing knowledge and tapping into it for community benefit. Others have probably tried what you’re trying, and can help you avoid common pitfalls. If you’ve just made an architectural choice that didn’t work out, share it, and help others avoid the pain. Read research from analysts, go to conferences or watch videos to observe case studies, and join online communities that offer a safe place to share mistakes and learn from others.Do: Experiment first using techniques like multi-region deploymentsIf you think you can operate systems across clouds, how about you first try doing it across regions in a specific cloud, suggests Corey. Getting a system to properly work across cloud regions isn’t trivial, he says, and that experience can help you uncover where you have architectural or operational constraints that will be even worse across cloud providers.This is great guidance if your multicloud aspirations involve using multiple clouds to power one application—versus the more standard definition of multicloud where you use different clouds for different applications—but can also surface issues in your support process or toolchain that fail when faced with distributed systems. Start with muti-region deployments and chaos engineering experiments before aggressively jumping into multicloud architectures.The Google Cloud takeDo the things above. It’s great advice. I’ll add three more things that we’ve learned from our customers.Don’t fear multicloud. You’re already doing it. You don’t single-source everything. As Corey mentioned, you probably already have one cloud for productivity tools, another for source code, another for cloud infrastructure. You’ll use software and application services from a mix of providers for a single app. You have that experience in your team and have been doing that for decades. What people do rightly worry about is using more than one infrastructure service beneath an application, as that can introduce latency, security, and logistical hurdles. Make sure you know which model your team is considering.Embrace the right foundational components, including Kubernetes. Will everything run on Kubernetes? Of course not. Don’t try to do that. But it also represents the closest thing we have to a multicloud API. Companies are using Kubernetes to stripe a consistent experience across clouds. And this isn’t just to orchestrate containers, but also to manage infrastructure and cloud-native services. Also, consider where you need other fundamental consistency across clouds, including areas like provisioning and identity federation.Use Google Cloud as your anchor. Here’s a fundamental question you have to decide for yourself: Are you going to bring your on-premises technology and practices to the cloud, or bring cloud technology and practices on-prem? We sincerely believe in the latter. Anchor to where you’re trying to get to. We offer Anthos as a way to build and run distributed Kubernetes fleets in Google Cloud and across clouds. By using a cloud-based backplane instead of an on-prem one, you’re offloading toil, leveraging managed services for scale and security, and introducing modern practices to the rest of your team.We learned a lot about multicloud through these discussions, and it seems like others did too. That’s why we’re going to do a second round of interviews with a new crop of experts so that we can keep digging deeper into this topic. Stay tuned!Related ArticleRegistration is open for Google Cloud Next: October 12–14Register now for Google Cloud Next on October 12–14, 2021Read Article
Quelle: Google Cloud Platform

Use Process Metrics for troubleshooting and resource attribution

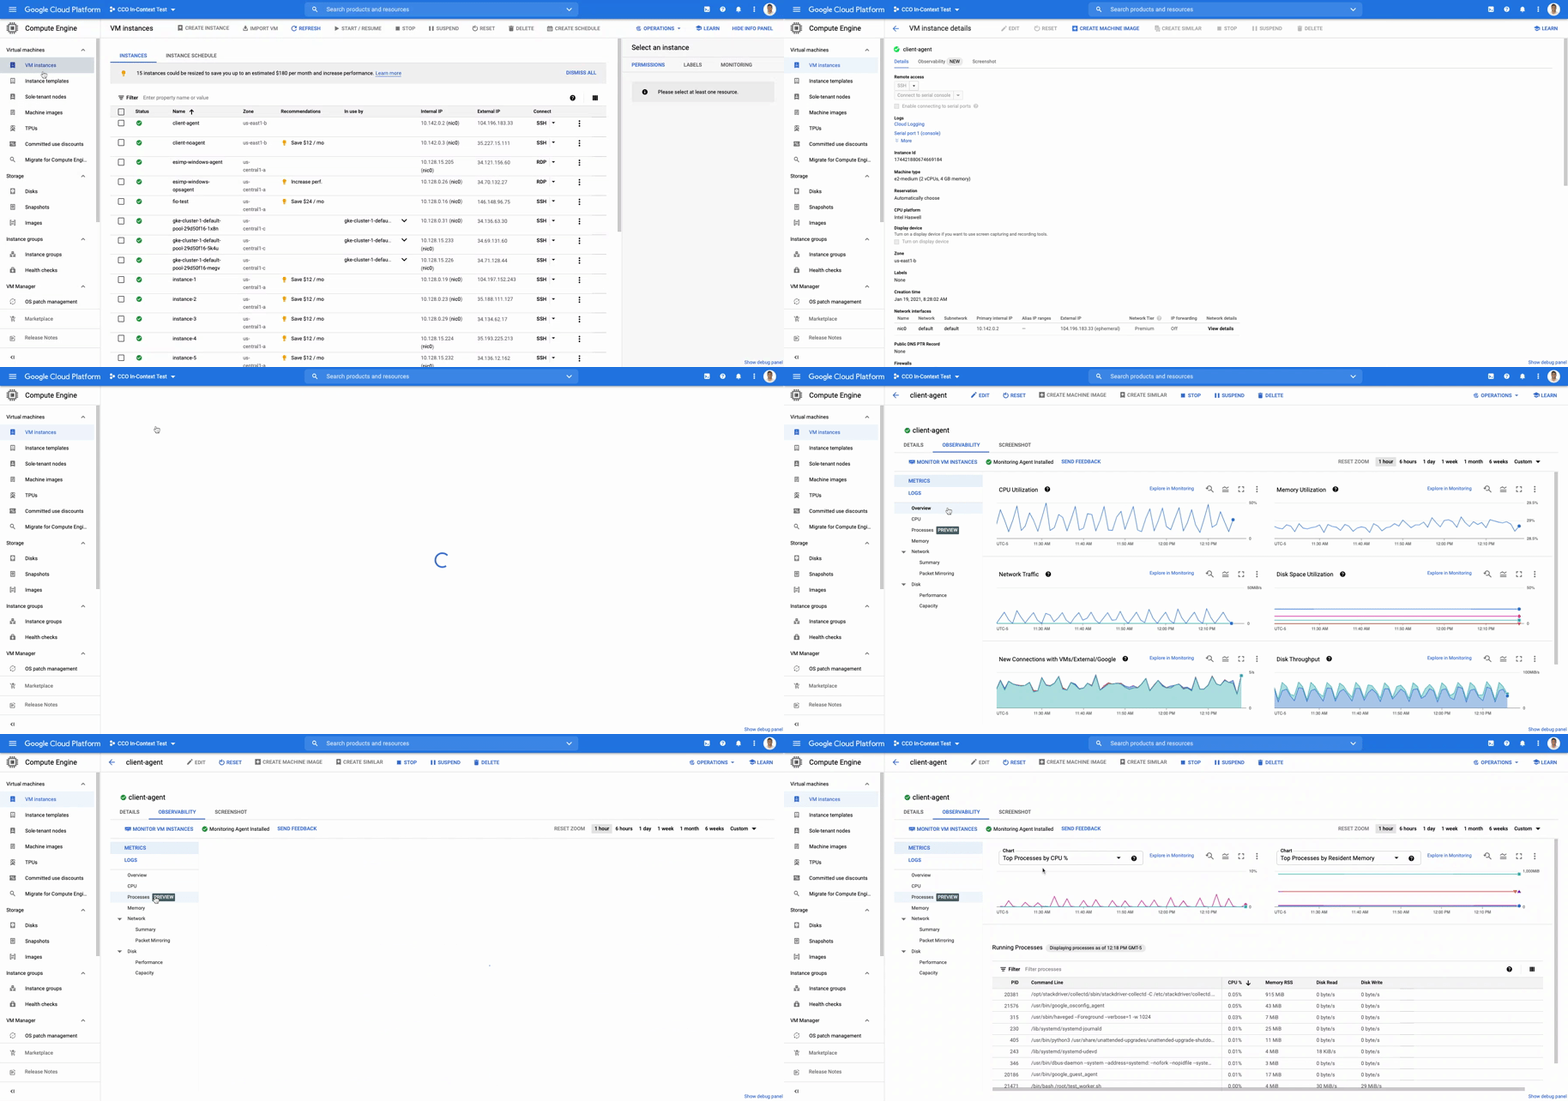
When you are experiencing an issue with your application or service, having deep visibility into both the infrastructure and the software powering your apps and services is critical. Most monitoring services provide insights at the Virtual Machine (VM) level, but few go further. To get a full picture of the state of your application or service, you need to know what processes are running on your infrastructure. That visibility into the processes running on your VMs is provided out of the box by the new Ops Agent and made available by default in Cloud Monitoring. Today we will cover how to access process metrics and why you should start monitoring them. Better visibility with process metricsThe data gathered by process metrics include CPU, memory, I/O, number of threads, and more, for any running processes and services on your VMs. When the Ops Agent or the Cloud Monitoring agent is installed, these metrics are captured at 60-second intervals and sent to Cloud Monitoring so you can visualize, analyze, track, and alert on them. A single VM may run tens or hundreds of processes, while you may have tens of thousands running across your fleet of VMs. As a developer, you may only care about seeing inside a single VM to troubleshoot and identify memory leaks or the source of performance issues.As an operator or IT Admin, you may be interested in aggregate resource consumption, building baseline views of compute, storage, and networking usage across your VM fleet. Then, when those baseline consumption levels break normal behaviors, you will know when to investigate your systems.Built for scale and ease of useCloud Monitoring is built on the same advanced backend that powers metrics across Google. This proven scalability means your metrics ingestion will be supported despite the extremely high cardinality. Additionally, our agents do not require any config file changes to turn on process metric monitoring.Lastly, our goal is to provide you the observability and telemetry data where, and when, you need it. So, like the rest of the operations suite, we deliver process metrics in the context of your infrastructure, directly in the VM admin console.Navigating to a single VM’s in-context process monitoring in GCEThe navigation is simple. Once you have the Ops Agent or the Cloud Monitoring agent installed in your VMs:Go to the Compute Engine console page and click on VM Instances Select the VM that you want to investigateIn the navigation menu on the top, click ObservabilityClick on MetricsLastly, click on ProcessesIn the window on the right you will see a chart and a table with all of the processes in your VM. You can also filter by time frame and sort by name or value. You do not need to do anything, other than have the agent installed, for the process to be detected and displayed.Fleet-wide metrics monitoringCloud Monitoring gives you a look across your fleet of VMs so you can identify the aggregated usage of resources by processes. This level of broad, yet granular, insight can drive your decisions around which software to run or how many VMs you need to optimally power your apps and services. Admins can perform a cost-savings analysis if they determine that certain processes are slowing down the work of a large number of VMs. The larger numbers of less powerful VMs can be replaced by fewer, more capable VMs.   To get this fleet-wide view:Navigate to Cloud Monitoring Click Dashboards in the left menuIn the All Dashboards list, click on VM InstancesTowards the top of the window, click on ProcessesThis provides many charts detailing the processes running across your fleet of VMs.The new Cloud Monitoring VM Fleet-wide Process view in the VM Instance DashboardGet started todayTo start identifying and monitoring your process metrics, you must first install the Ops Agent, or have installed the legacy Cloud Monitoring agent. Once that is complete, the process metrics data will automatically be ingested into Cloud Monitoring and the VM admin console.If you have any questions, or to join the conversation with other developers, operators, DevOps, and SREs, visit the Cloud Operations page in the Google Cloud Community.Related ArticleThe Ops Agent is now GA and it leverages OpenTelemetryToday, we’re happy to announce the General Availability of the new Ops Agent, which replaces both the Logging and Monitoring agents and s…Read Article
Quelle: Google Cloud Platform
How to conduct live network forensics in GCP

Forensics is the application of science to criminal and civil laws. It is a proven approach for gathering and processing evidence at a crime scene. An integral step in the forensics process is the isolation of the scene without contaminating or modifying the evidence. The isolation step prevents any further contamination or tampering with possible evidence. The same philosophy can be applied to the investigation of digital events.In this post we will review methods, tactics and architecture designs to isolate an infected VM while still making it accessible to forensic tools. The goal is to allow access so that data and evidence can be captured while protecting other assets. There are many forensic tools for networking that can be used to analyze the captured traffic. This post does not cover these tools but rather how to configure GCP to capture live traffic in the most efficient and secured way. Once traffic is captured, customers can use whatever tools they prefer to run the analysis. More details about these tools and required agents can be found here and details about open source tooling that Google and others are developing are available here.In cloud security context, when a VM shows signs of compromise, the most common immediate reaction is to take a snapshot, shut down the instance and relocate the image snapshot to an isolated environment, a method known as “dead analysis”. However, shutting down the instance will impede an important step in the investigation and digital forensics, as some important information in a buffer or the RAM may be lost. The other forensic approach is “live analysis”, in which the VM is kept on and evidence is gathered from the VM directly. Live forensics enables the imaging of RAM, bypasses most hard drives and software encryption, determines the cause of abnormal traffic, and is extremely useful when dealing with active network intrusions. This process is usually performed by forensic analysts. For example, if there is a good chance the malware resides only in memory then live forensics is, in some cases, the only way to capture and analyze the malware. In this method, in addition to disk and memory evidence, a forensic analysis can also capture live-network from data sent over the compromised VM network interfaces. Some of the benefits of collecting live networks are reconstruction and visualizing traffic flow in real-time, in particular during active network intrusions or attacks. In the cloud, a VM must be isolated when it becomes apparent that an incident has happened, in order to protect other VMs from being infected. Our Cloud Forensics 101 session covers the process and required artifacts, such as logs, that need to be collected for cloud forensics. What happens when your image is compromisedLet’s now assume that one of the VMs in your infrastructure has been compromised and alarms are coming from products such as GCP’s Cloud Security and Command Center, Chronicle backstory or your SIEM. An incident response plan consists of 3 phases: preparation (actions taken before an attack), detection (actions taken during an attack) and response (actions taken after an attack). During the detection phase, the Computer Security Incident Response Team (CSIRT) or threat analysts decide whether live acquisition analysis is required. If live forensics is required, for example when it is vital to acquire a VM’s RAM, then one of the first courses of action is to isolate and contain the VM from the rest of the world and connect the Forensics VPC to the VM for investigation. The forensics VPC resides in a forensics GCP project, it includes digital forensics tools to capture evidence from the VM such as SANS Investigative Forensics Toolkit – SIFT, The Sleuth Kit, Autopsy, Encase, FTK and alike. These tools are already installed, configured, tested and ready to use. The forensics project will also save and preserve evidence such as disk and memory images for forensic review.We’ll cover two scenarios in this post, the first scenario is to isolate the image and connect the forensics VPC to the image for live acquisition. In the second scenario we will also capture live traffic from the isolated image for live network digital forensics. To capture live traffic from the infected VM, we will leverage the GCP Packet Mirroring service to duplicate all traffic going in and out of the VM and send it to a Forensics VPC for analysis. Network forensics analysis tools such as Palo Alto VM-Series for IDS, ExtraHop Reveal(x), CheckPoint CloudGuard, Arkime (formerly Moloch), Corelight are installed, configured and ready for deployment in the Forensics VPC, these tools will be used to analyze the duplicate network traffic. Isolating the infected VM from other resources and connecting the forensics VPCAs part of the Incident Response plan preparation phase, the CSIRT created a Google Cloud Forensics Project. Since the Forensics project will be used only when needed, it’s better to automate the creation of the project and its resources with a tool such as Terraform. It is important to grant access to this project only to individuals and groups who deal with incident response and forensics, such as CSIRT. As shown in figure 1, the Forensics project on the right includes its own VPC, non-overlapped subnet and VM images with pre-installed and pre-configured forensics tools. Internal load-balancer and instance-groups are also configured, we will use these resources to capture live traffic, as described later in this post.Click to enlargeIn order to contain the spread of any malware or network activity, such as data exfiltration, we’ll isolate the VM with VPC firewall rules. The GCP VPC firewall is a distributed firewall that always enforces its rules, protecting the instances regardless of their configuration and operating systems. In other words, the compromised VM cannot override the firewall enforcement if its policies follow the principle of least privilege . Rules can be applied to all instances in the network, target network tags or service accounts.Step 1 in the diagram above shows how an infected VM is isolated from the rest of the network by firewall rules that deny any ingress and egress traffic from any CIDR beside the forensics subnet CIDR. The infected VM is tagged with a unique network tag, for example “<image-name>_InfectedVM”, then firewalls rules are applied on the network tag. This ensures that the infected VM is isolated from the project and the Internet while enabling access to the VM via VPC peering which we’ll configure in step-2. You can learn more about VPC firewalls rules here.In step 2, the VPC from the forensics project is peered with the VPC in the production project. When VPC peering is established routes are exchanged between the VPCs. By default, VPC peering exchanges all subnet routes, however, custom routes can also be filtered if required. At this point, the VM from the forensics project can communicate with the infected VM and start the live forensics analysis job using the pre-installed and pre-configured forensics tools.Shared VPC is a network construct that allows you to connect resources from multiple projects, called service-projects, to a common VPC in a host-project. VPCs from different projects can securely communicate with each other via the hosted project network while centralizing the network administration. Figure 2 depicts Shared VPC topology, rather than using VPC peering, during step 2 the Forensics project is simply attached to the host project. After the attachment, the Shared VPC allows the forensics tools to communicate with the infected VMs.Click to enlargeCapturing live network traffic with Google Traffic MirroringIf live network forensics is required, for example during active network intrusions, then the incoming and outgoing traffic needs to be duplicated and captured. While VPC Flow logs capture the networking metadata telemetry, this is not enough for live network forensics analysis. GCP Packet Mirroring clones the traffic of a specified instance in a VPC and forwards it to a specified internal load balancer which collects the mirrored traffic and sends it to an attached instance group. Packet mirroring captures all the traffic from the specified subnet, network tags, or instance name. Figure 3 depicts the steps that allow the compromised VM to communicate with the rest of the world (for example beaconing with C&C) while capturing all traffic for investigation in a peered VPC deployment.Click to enlargeFigure 4 depicts the steps that allow the compromised VM to communicate with the rest of the world while capturing all traffic for investigation in a shared VPC deployment.Click to enlargeWe will use the Forensics’ project internal load balancer and the instance group VMs which include packet capture and analysis tools. Note that production and forensics networks must be in the same region. Detailed steps to configure packet mirroring are available on this page. If you are using a Shared VPC then check thePacket Mirroring configuration for Shared VPC for configuration details. Figure 4 depicts the packet mirroring flow in a shared VPC topology.It is recommended to automate and periodically test the process to make sure that in case of an incident, the entire setup and Forensics toolchain can be quickly deployed. If after initial investigation a suspicious destination, such as a Command and Control [C&C] Server, has been identified, then the Packet Mirroring policy can be adjusted with a policy filterthat only mirrors traffic from that C&C server IP address.An incident management plan must be in place for companies using cloud services, and this plan should also include the option of using live acquisition when necessary. design and preparation for forensics acquisition allows the company to build the infrastructure that can be deployed and connected to the appropriate VM automatically. The architectures described in this post can help the process of collecting and preserving vital evidence for the forensic process, while the incident response team resolves the incident.Related ArticleRegistration is open for Google Cloud Next: October 12–14Register now for Google Cloud Next on October 12–14, 2021Read Article
Quelle: Google Cloud Platform

Using Compute Engine: Users’ top questions answered

Compute Engine lets you create and run virtual machines (VMs) on Google’s infrastructure, allowing you to launch large compute clusters with ease. When it comes to getting started with Compute Engine, our customers have lots of questions—but some questions come up more often than others. We looked at an internal list of the most popular Compute Engine documentation pages over a 30-day period to find out what topics were explored by users again and again. Here are the top four questions users have about Compute Engine, in order.1. What are the different machine familiesCompute Engine lets you select the right machine for your needs. You can choose from a curated set of predefined virtual machine (VM) configurations optimized for specific workloads, ranging from small-level purpose to large-scale use cases or create a machine type customized to your needs with our custom machine type feature. Compute Engine machines are categorized by machine family, including: General-purpose: Best price-performance ratio for a variety of standard and cloud-native workloads Compute-optimized: Highest performance per core for compute-intensive workloads, such as ad serving or media transcoding  Memory-optimized: More compute and memory per core than any other family for memory-intensive workloads, such as SAP HANA or in-memory data analytics Accelerator-optimized: Designed for your most demanding workloads, such as machine learning (ML) or high performance computing (HPC)Read the documentation to learn more about each machine family category.2. How to connect to VMs using advanced methodsIn general, we recommend using the Google Cloud Console and the gcloud command-line tool to connect to Linux VM instances. However, some of our customers want to use third-party tools, or require alternative connection configurations. In these cases, there are several methods that might fit your needs better than the standard connection options:Connecting to instances using third-party tools (e.g. Windows PuTTY, Chrome OS Secure Shell app), or MacOS or Linux local terminal) Connecting to instances without external IP addressesConnecting to instances as the root user Manually connecting between instances and running commands as a service accountRead the documentation to learn about advanced methods for connecting Linux VMs.3. How to set up OS LoginOS Login lets you use IAM roles and permissions to manage access and permissions to VMs. OS Login is the recommended way to manage users across multiple instances or projects. OS Login provides:Automatic Linux account lifecycle managementFine-grained authorization using Google IAM without having to grant broader privilegesAutomatic permissions updates to prevent unwanted accessAbility to import existing Linux accounts from Active Directory (AD) and Lightweight Directory Access Protocol (LDAP)You can also add an extra layer of security by setting up OS Login with two-factor authentication or manage organization access by setting up organization policies.Read the documentation to learn how to configure OS login and connect to your instances.4. How to manage SSH keys in metadata Compute Engine allows you to manually manage SSH keys and local user accounts by editing public SSH key metadata.You can add  public SSH keys to instance and project metadata using: The Google Cloud Console The gcloud command-line tool API methods from the Google Cloud Client LibrariesRead the documentation to learn how to manually manage SSH keys and local user accounts in metadata.Don’t see your question here? Check out the Compute Engine documentation for all of our recommended guides, tutorials, and resources.Related ArticleWhere should I run my stuff? Choosing a Google Cloud compute optionWhere should you run your workload? It depends…Choosing the right infrastructure options to run your application is critical, both for …Read Article
Quelle: Google Cloud Platform
Scalable tech support via AI-augmented chat

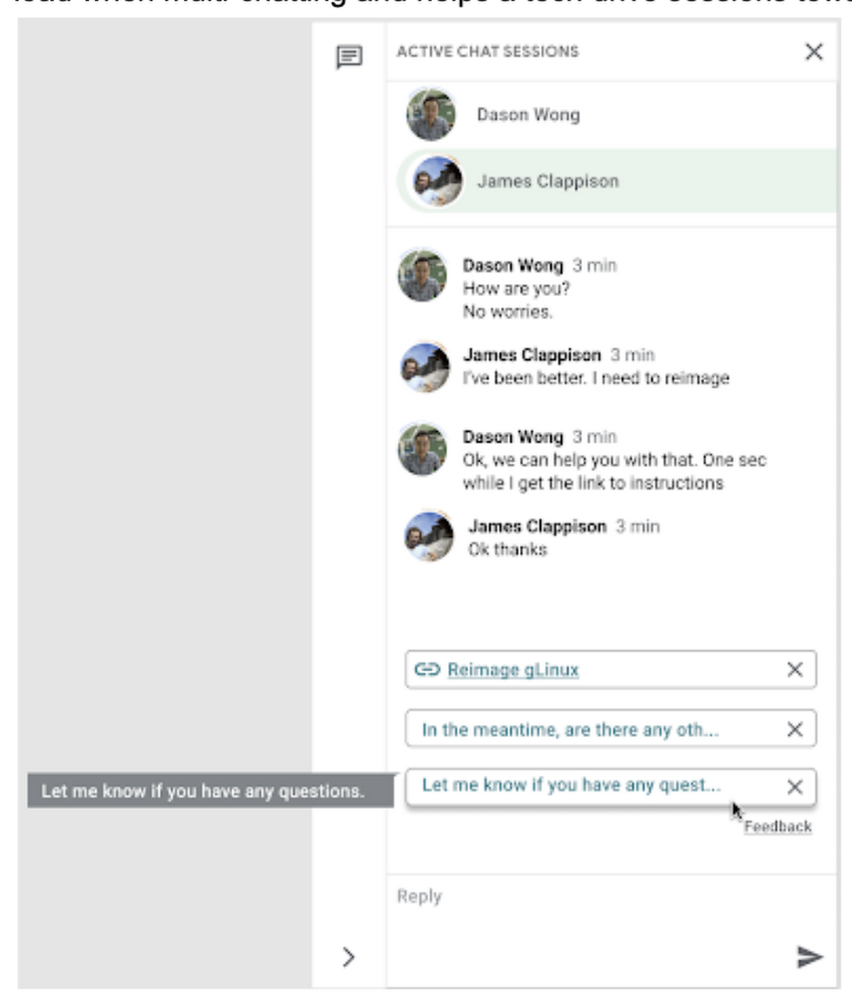
As Googlers transitioned to working from home during the pandemic, more and more turned to chat-based support to help them fix technical problems. Google’s IT support team looked at many options to help us meet the increased demand for tech support quickly and efficiently. More staff? Not easy during a pandemic. Let service levels drop? Definitely not. Outsource? Not possible with our IT requirements. Automation? Maybe, just maybe…How could we use AI to scale up our support operations, making our team more efficient?The answer: Smart Reply, a technology developed by a Google Research team with expertise in machine learning, natural language understanding, and conversation modeling. This product provided us with an opportunity to improve our agents’ ability to respond to queries from Googlers by using our corpus of chat data.  Smart Reply trains a model that provides suggestions to techs in real time. This reduces the cognitive load when multi-chatting and helps a tech drive sessions towards resolution.In the solution detailed below, our hope is that IT teams in a similar situation can find best practices and a few shortcuts to implementing the same kind of time saving solutions. Let’s get into it!Challenges in preparing our dataOur tech support service for Google employees—Techstop—provides a complex service, offering support for a range of products and technology stacks through chat, email, and other channels. Techstop has a lot of data. We receive hundreds of thousands of requests for help per year. As Google has evolved we’ve used a single database for all internal support data, storing it as text, rather than as protocol buffers. Not so good for model training. To protect user privacy, we want to ensure no PII (personal identifiable information – e.g. usernames, real names, addresses, or phone numbers) makes it into the model.To address these challenges we built a FlumeJava pipeline that takes our text and splits each message sent by agent and requester into individual lines, stored as repeated fields in a protocol buffer. As our pipe is executing this task, it also sends text to the Google Cloud DLP API, removing personal information from the session text, replacing it with a redaction that we can later use on our frontend. With the data prepared in the correct format, we are able to begin our model training. The model provides next message suggestions for techs based on the overall context of the conversation. To train the model we implemented tokenization, encoding, and dialogue attributes.Splitting it upThe messages between the agent and customer are tokenized: broken up into discrete chunks for easier use. This splitting of text into tokens must be carefully considered for several reasons:Tokenization determines the size of the vocabulary needed to cover the text.Tokens should attempt to split along logical boundaries, aiming to extract the meaning of the text.Tradeoffs can be made between the size of each token, with smaller tokens increasing processing requirements but enabling easier correlation between different spans of text.There are many ways to tokenize text (SAFT, splitting on white spaces, etc.), here we chose sentence piece tokenization, with each token referring to a word segment. Prediction with encodersTraining the neural network with tokenized values has gone through several iterations. The team used an Encoder-Decoder architecture that took a given vector along with a token and used a softmax function to predict the probability that the token was likely to be the next token in the sentence/conversation. Below, a diagram represents this method using LSTM-based recurrent networks. The power of this type of encoding comes from the ability of the encoder to effectively predict not just the next token, but the next series of tokens.This has proven very useful for Smart Reply. In order to find the optimal sequence, an exponential search over each tree of possible future tokens is required. For this we opted to use beam search over a fixed-size list of best candidates, aiming to avoid increasing the overall memory use and run time for returning a list of suggestions. To do this we arranged tokens in a trie, and used a number of post processing techniques, as well as calculating a heuristic max score for a given candidate, to reduce the time it takes to iterate through the entire token list. While this improves the run time, the model tends to prefer shorter sequences. In order to help reduce latency and improve control we decided to move to an Encoder-Encoder architecture. Instead of predicting a single next token and decoding a sequence of following predictions with multiple calls to the model, it instead encodes a candidate sequence with the neural network.In practice, the two vectors – the context encoding and the encoding of a single candidate output – are combined with dot product to arrive at a score for the given candidate. The goal of this network is to maximize the score for true candidates – e.g. candidates that did appear in the training set – and minimize false candidates.Choosing how to sample negatives affects the model training greatly. Below are some strategies that can be employed:Using positive labels from other training examples in the batch.Drawing randomly from a set of common messages. This assumes that the empirical probability of each message is sampled correctly. Using messages from context.Generating negatives from another model.As this encoding generates a fixed list of candidates that can be precomputed and stored, each time a prediction is needed, only the context encoding needs to be computed, then multiplied by the matrix of candidate embeddings. This reduces both the time from the beam search method and the inherent bias towards shorter responses.Dialogue AttributesConversations are more than simple text modeling. The overall flow of the conversation between participants provides important information, changing the attributes of each message. The context, such as who said what to whom and when, offers useful bits of input for the model when making a prediction. To that end the model uses the following attributes during its prediction:Local User ID’s – we set a finite number of participants for a given conversation to represent the turn taking between messages, assigning values to those participants. In most cases for support sessions there are 2 participants, requiring ID 0, and 1.Replies vs continuations – initially modeling focused only on replies. However, in practice conversations also include instances where participants are following up on the previously sent message. Given this, the model is trained for both same-user suggestions and “other” user suggestions.Timestamps  – gaps in conversation can indicate a number of different things. From a support perspective, gaps may indicate that the user has disconnected. The model takes this information and focuses on the time elapsed between messages, providing different predictions based on the values. Post processingSuggestions can then be manipulated to get a more desirable final ranking. Such post-processing includes:Preferring longer suggestions by adding a token factor, generated by multiplying the number of tokens in the current candidate.Demoting suggestions with a high level of overlap with previously sent messages.Promoting more diverse suggestions based on embedding distance similarities.To help us tune and focus on the best responses the team created a priority list. This gives us the opportunity to influence the model’s output, ensuring that responses that are incorrect can be de-prioritized. Abstractly it can be thought of as a filter that can be calibrated to best suit the client’s needs. Getting suggestions to agentsWith our model ready we now needed to get it in the hands of our techs. We wanted our solution to be as agnostic to our chat platform as possible, allowing us to be agile when facing tooling changes and speeding up our ability to deploy other efficiency features. To this end we wanted an API that we could query either via gRPC or via HTTPs. We designed a Google Cloud API, responsible for logging usage as well as acting as a bridge between our model and a Chrome Extension we would be using as a frontend.The hidden step, measurementOnce we had our model, infrastructure, and extension in place we were left with the big question for any IT project. What was our impact? One of the great things about working in IT at Google is that it’s never dull. We have constant changes, be it planned or unplanned. However, this does complicate measuring the success of a deployment like this. Did we improve our service or was it just a quiet month?In order to be satisfied with our results we conducted an A/B experiment, with some of our techs using our extension, and the others not. The groups were chosen at random with a distribution of techs across our global team, including a mix of techs with varying levels of experience ranging from 3 to 26 months. Our primary goal was to measure tech support efficiency when using the tool. We looked at two key metrics as proxies for tech efficiency: The overall length of the chat. The number of messages sent by the tech.Evaluating our experimentTo evaluate our data we used a two-sample permutation test. We had a null hypothesis that techs using the extension would not have a lower time-to-resolution, or be able to send more messages, than those without the extension. The alternative hypothesis was that techs using the extension would be able to resolve sessions quicker or send more messages in approximately the same time.We took the mid mean of our data, using pandas to trim outliers greater than 3 standard deviations away. As the distribution of our chat lengths is not normal, with significant right skew caused by a long tail of longer issues, we opted to measure the difference in means, relying on central limit theorem (CLT) to provide us with our significance values. Any result with a p-value between 1.0 and 9.0 would be rejected. Across the entire pool we saw a decrease in chat lengths of 36 seconds.In reference to the number of chat messages we saw techs on average being able to send 5-6 messages more in less time. In short, we saw techs were able to send more messages in a shorter period of time. Our results also showed that these improvements increased with support agent tenure, and our more senior techs were able to save an average of ~4 minutes per support interaction.Overall we were pleased with the results. While things weren’t perfect, it looked like we were onto a good thing.So what’s next for us?Like any ML project, the better the data the better the result. We’ll be spending time looking into how to provide canonical suggestions to our support agents by clustering results coming from our allow list. We also want to investigate ways of making improvements to the support articles provided by the model, as anything that helps our techs, particularly the junior ones, with discoverability will be a huge win for us.How can you do this?A successful applied AI project always starts with data. Begin by gathering the information you have, segmenting it up, and then starting to process it. The interaction data you feed in will determine the quality of the suggestions you get, so make sure you select for the patterns you want to reinforce.Our Contact Center AI allows tokenization, encoding and reporting, without you needing to design or train your own model, or create your own measurements. It handles all the training for you, once your data is formatted properly. You’ll still need to determine how best to integrate its suggestions to your support system’s front-end. We also recommend doing statistical modeling to find out if the suggestions are making your support experience better. As we gave our technicians ready-made replies to chat interactions, we saved time for our support team. We hope you’ll try using these methods to help your support team scale.Related ArticleRunning Anthos inside GoogleHow we run our third-party software on Anthos at GoogleRead Article
Quelle: Google Cloud Platform