Load balancing Google Cloud VMware Engine with Traffic Director

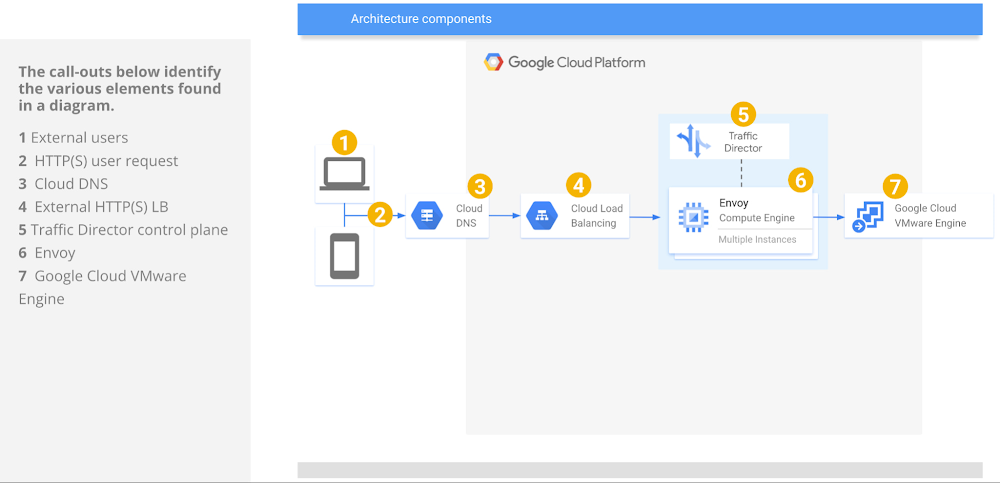
The following solution brief discusses a GCVE + Traffic Director implementation aimed at providing customers an easy way to scale out web services, while enabling application migrations to Google Cloud. The solution is built on top of a flexibleandopen architecture that exemplifies the unique capabilities of Google Cloud Platform. Let’s elaborate:Easy: The full configuration takes minutes to implement and can be scripted or defined with Infrastructure-as-Code (IaC) for rapid consumption and minimal errors.Flexible and open: The solution relies on Envoy, an open source platform that enjoys tremendous popularity with the network and application communities.The availability of Google Cloud VMware Engine (GCVE) has given GCP customers the ability to deploy Cloud applications on a certified VMware stack that is managed, supported and maintained by Google. Many of these customers also demand seamless integration between their applications running on GCVE, and the various infrastructure services that are provided natively by our platform such as Google Kubernetes Engine (GKE), or serverless frameworks like Cloud Functions,  App Engine or Cloud Run. Networking services are at the top of that list.In this blog, we discuss how Traffic Director, a fully managed control plane for Service Mesh, can be combined with our portfolio of load balancers and withhybrid network endpoint groups (hybrid NEG) to provide a high-performance front-end for web services hosted in VMware Engine.Traffic Director also serves as the glue that links the native GCP load balancers and the GCVE backends, with the objective of enabling these technical benefits:Certificate Authority integration, for full lifecycle management of SSL certificates.DDoS protection with Cloud Armor, helps protect your applications and websites against denial of service and web attacks.Cloud CDN, for cached content delivery.Intelligent anycast with a Single IP and Global Reach, for improved failover, resiliency and availability. Bring Your Own IP (BYOIP),  to provision and use your own public IP addresses for Google Cloud resources.Diverse backend types integration in addition to GCVE, such as GCE, GKE, Cloud Storage and serverless. Scenario #1 – External load balancerThe following diagram provides a summary of the GCP components involved in this architecture:This scenario shows an external HTTP(S) load balancer used to forward traffic to the Traffic Director dataplane component, implemented as a fleet of Envoy proxies. Users can create routable NSX segments and centralize the definition of all traffic policies in Traffic Director. The GCVE VM IP and port pairs are specified directly in the hybrid NEG, meaning all network operations are fully managed by a Google Cloud control plane.Alternatively, GCVE VMs can be deployed to a non-routable NSX segment behind an NSX L4 load balancer configured at the Tier-1 level, and the Load Balancer VIP can be exported to the customer VPC via the import and export of routes in the VPC Peering connection. It is important to note that in GCVE, it is highly recommended that NSX-T load balancers be associated with Tier-1 gateways, and not the Tier-0 gateway.The steps to configure load balancers in NSX-T, including server pools, health checks, virtual servers and distribution algorithms are documented by VMware and not covered in this document.Fronting the web applications with an NSX load balancer would allow for the following:Only VIP routes are announced, allowing the use of private IP addresses in the web tier, as well as overlapping IP addresses in case of multi-tenant deployments.Internal clients (applications inside of GCP or GCVE) can point to the VIP of the NSX Load Balancer, while external clients can point to the public VIP in front of a native, GCP external load balancer.A L7 NSX load balancer can also be used (not discussed in this example), for advanced application-layer services, such as cookie session persistence, URL mapping, and more.To recap, the implementation discussed in this scenario shows an external HTTP(S) load balancer, but please note that an external TCP/UDP network load balancer or TCP Proxy could also be used for supporting protocols other than HTTP(S). There are certain restrictions when using Traffic Director in L4 mode, such as a single backend service per target proxy, which need to be accounted for when implementing your architecture.Scenario #2 – Internal load balancerIn this scenario, the only change is the load balancing platform used to route requests to Traffic Director-managed Envoy proxies. This use case may be appropriate in certain situations, for instance, whenever the users want to take advantage of advanced traffic management capabilities not supported without Traffic Director, as documented here.The Envoy-managed proxies controlled by Traffic Director can send traffic directly to GCVE workloads:Alternately, and similar to what was discussed in Scenario #1, an NSX LB VIP can be used instead of the explicit GCVE VM IPs, which introduces an extra load balancing layer:To recap, this scenario shows a possible configuration with L7 Internal Load Balancer, but an L4 Internal Load Balancer can also be used for supporting protocols other than HTTP(S). Please note there are certain considerations when leveraging L4 vs. L7 load balancers in combination with Traffic Director, which are all  documented here.ConclusionWith the combination of multiple GCP products, customers can take advantage of the various distributed network services offered by Google, such as global load balancing, while hosting their applications on a Google Cloud VMware Engine environment that provides continuity for their operations, without sacrificing availability, reliability or performance.Go ahead and review the GCVE networking whitepaper today. For additional information about VMware Engine, please visit the VMware Engine landing page, and explore our interactive tutorials. And be on the lookout for future articles, where we will discuss how VMware Engine integrates with other core GCP infrastructure and data services.Related ArticleNew in Google Cloud VMware Engine: Single nodes, certifications and moreThe latest version of Google Cloud VMware Engine now supports single node clouds, compliance certs and Toronto availabilityRead Article
Quelle: Google Cloud Platform
Top 5 use cases for Google Cloud Spot VMs explained + best practices

Cloud was built on the premise of flexible infrastructure that grows and shrinks with your application demands. Applications that can take advantage of this elastic infrastructure and scale horizontally with the demands of your application offer significant advantages over competitors by allowing infrastructure costs to scale up and down along with the demand. Google Cloud’s Spot VMs enable our customers to make the most of our idle capacity where and when it is available. Spot VMs are offered at a significant discount from list price to drive maximum savings provided customers have flexible, stateless workloads that can handle preemption. Spot VMs can be reclaimed by Google (with a 30 second notice). When you deploy the right workloads on Spot VMs, you are able to maintain elasticity while also taking advantage of the best discounts Google has to offer.This blog discusses a few common use cases and design patterns we have seen customers utilize Spot VMs for and discusses the best practices for these use cases. While this is not an exhaustive list, this blog serves as a template to help customers make the most of the Spot VM savings while still reaching their application and workload objectives. Media renderingRendering workloads (such as rendering 2D or 3D elements) can be both compute and time intensive, requiring skilled IT resources to manage render farms. Job management becomes even more difficult when the render farm is at 100% utilization. Spot VMs are ideal resources for fault-tolerant rendering workloads; when combined with a queuing system customers can integrate the preemption notice to track preempted jobs. This allows you to build a render farm which benefits from reduced TCO. If your renderer supports taking snapshots of in-progress renders at specified intervals, writing these snapshots to a persistent data store (Cloud Storage) will limit any loss in work in the event the Spot VM is preempted. As subsequent Spot VMs are created, they can pick up where the old ones left off by using the snapshots on Cloud Storage. You can also leverage the new “suspend and resume a VM” feature which allows you to keep the VM instances during the preemption event but not incur any charges for it while the VM is not in use.Additionally, we have helped customers combine local render farms in their existing datacenters with cloud-based render farms, allowing a hybrid approach for large or numerous render workloads without increasing their investment in their physical datacenters. Not only does this reduce their capital expenses, but it adds flexible scalability to the existing farm and provides a better experience for their business partners. Financial modelingCapital market firms have significant investments in their infrastructure to create state-of-the-art, world-class compute grids. Since compute grids began, in-house researchers leverage these large grids in physical datacenters to test their trading hypotheses and perform backtesting. But as the business grows, what happens when all the researchers each have a brilliant idea and want to test that out at the same time? Researchers then have to compete with one another for the same limited resources, which leads to queueing their jobs and increased lead times for testing their ideas. And in financial markets, time is always scarce. Enter cloud computing and Spot VMs. Capital market firms can use Google Cloud as an extension of their on-premises grid by spinning up temporary compute resources. Or they can go all in on cloud and build their grid in Google Cloud entirely. In either scenario, Spot VMs are ideal candidates for bursting research workloads given the transient nature of the workload and heavily discounted prices of VMs. This enables researchers to test more hypotheses at a lower cost per test, in turn producing better models for firms. Google Cloud Spot VM discounts not only apply to the VMs themselves, but also to any GPU accelerator attached to them, providing even more processing power to a firm looking to process larger more complex models. Once these jobs have completed, Spot VMs can be quickly spun down, maintaining strict control on costs. CI/CD pipelinesContinuous integration (CI) and Continuous delivery (CD) tools are very common for the modern application developer. These tools allow developers to create a testing pipeline that enables developers and quality engineers to ensure the newly created code works with their environment and that the deployment process does not break anything during deployment. CI/CD tools and test environments are great workloads to run on Spot VMs since CI/CD pipelines are not mission-critical for most companies — a delay in deployment or testing by 15 minutes, or even a few hours, is not material to their business. This means that companies can lower the cost of operating their CI/CD pipeline significantly through the use of Spot VMs. A simple example of this would be to install the Jenkins Master Server in a Managed Instance Group (MIG) with the VM type set to Spot. If the VM gets preempted, the CI/CD pipelines will stall until the MIG can find resources again to spin up a new VM. The first reaction may be concern that Jenkins persists data locally, which is problematic for Spot VMs. However, customers can move the Jenkins directory (/var/lib/Jenkins) to Google Cloud Filestore and preserve this data. Then when the new Spot VM spins up, it will reconnect to the directory. In the case of a large-scale Jenkins deployment, build VMs can utilize Spot VMs as part of a MIG to scale as necessary while ensuring that the builds can be maintained with on-demand VMs. This blended approach removes any risk to the builds, while still allowing customers to save up to 91% in costs of the additional VMs versus traditional on-demand VMs.Web services and appsLarge online retailers have found ways to drive massive increases in order volume. Typically companies like this target a specific time each month, such as the last day of the month, through a unique promotion process. This means that they are in many cases creating a Black Friday/Cyber Monday-style event, each and every month! In order to support this, companies traditionally used a “Build it like a stadium for Super Bowl Sunday” model. The issue with that, and a reason most professional sports teams have practice facilities, is that it’s very expensive to keep all the lights, climate control, and ancillary equipment running for the sole purpose of practice. 29-30 days of a month most infrastructure sits idle, wasting HVAC, electricity, etc. However, using the elasticity of cloud, we could manage this capacity and turn it up only when necessary. But to drive even more optimization and savings, we turn to Spot VMs. Spot VMs really shine during these kinds of scale-out events. Imagine the above scenario: what if behind a load balancer we could have:One MIG to help scale the web frontends. This MIG will be sized with on-demand VMs to handle day-to-day traffic.A second MIG for Spot VMs that scales up starting at 11:45pm the night prior to the end of month. The first and second MIG can now handle ~80-90% of the workload. A third MIG of on-demand VMs that spins up as a workload bursts to handle any remaining traffic, should the Spot MIG not be able to find enough capacity, thus ensuring we’re meeting our SLAs as well as keeping costs as tight as possible. KubernetesNow you may say “Well that’s all well and good, but we’re a fully modernized container shop, using Google Kubernetes Engine (GKE).” You are in luck — Spot VMs are integrated with GKE, enabling you to quickly and easily save on your GKE workloads by using Spot VMs with standard GKE clusters or Spot Pods with your Autopilotclusters. GKE supports gracefully shutting downSpot VMs, notifying your workloads that they will be shut down and giving them time to cleanly exit. GKE then automatically reschedules your deployments. With Spot Pods, you can use Kubernetes nodeSelectors and/or Node affinity to control the placement of spot workloads, striking the right balance between cost and availability across spot and on-demand compute.General best practicesTo take advantage of Spot VMs, your use case doesn’t have to be an exact match to any of those described above. If the workload is stateless, scalable, can be stopped and checkpointed in less than 30 seconds, or is location- and hardware-flexible, then they may be a good fit for Spot VMs.There are many several actions you can take to help ensure your Spot workloads run as smoothly as possible. Below we outline a few best practices you should consider:1. Deploy Spot behindRegional Managed Instance Groups (RMIGs):RMIGs are a great fit for Spot workloads given the RMIG’s ability to recreate instances which are preempted.Using your workload’s profile, determine the RMIG’s target distribution shape. For example, with a batch research workload, you might select an ANY target distribution shape. This will allow for Spot instances to be distributed in any manner across the various zones, thereby taking advantage of any underutilized resources. You can use a mix of on-demand RMIGs and Spot RMIGs to maintain stateful applications while increasing availability in a cost effective manner.2. Ensure you have a shutdown script:In the event of Spot VM preemptions, use a shutdown script to enable checkpointing to Cloud Storage for your workloads as well as perform any graceful shutdown processes.When drafting your shutdown script, test it out on an instance by either manually stopping or deleting the instance with the shutdown script attached and validate the intended behavior.3. Write check-point files to Cloud Storage.4. Consider using multiple MIGs behind your load balancer.Whether your workload is graphics rendering, financial modeling, scaled-out ecommerce, or any other stateless use case, Spot VMs are the best and easiest way to reduce your cost of operating it by more than 60%. By following the examples and best practices above, you can ensure that Spot VMs will create the right outcome. Get started today with a free trial of Google Cloud. AcknowledgementSpecial thanks to Dan Sheppard, Product Manager for Cloud Compute, for contributing to this post.
Quelle: Google Cloud Platform

MLOPs Blog Series Part 2: Testing robustness of secure machine learning systems using machine learning ops

Robustness is the ability of a closed-loop system to tolerate perturbations or anomalies while system parameters are varied over a wide range. There are three essential tests to ensure that the machine learning system is robust in the production environments: unit testing, data and model testing, and integration testing.

Unit testing

Tests are performed on individual components that each have a single function within the bigger system (for example, a function that creates a new feature, a column in a DataFrame, or a function that adds two numbers). We can perform unit tests on individual functions or components; a recommended method for performing unit tests is the Arrange, Act, Assert (AAA) approach:

1.    Arrange: Set up the schema, create object instances, and create test data/inputs.
2.    Act: Execute code, call methods, set properties, and apply inputs to the components to test.
3.    Assert: Check the results, validate (confirm that the outputs received are as expected), and clean (test-related remains).

Data and model testing

It is important to test the integrity of the data and models in operation. Tests can be performed in the MLOps pipeline to validate the integrity of data and the model robustness for training and inference. The following are some general tests that can be performed to validate the integrity of data and the robustness of the models:

1.    Data testing: The integrity of the test data can be checked by inspecting the following five factors—accuracy, completeness, consistency, relevance, and timeliness. Some important aspects to consider when ingesting or exporting data for model training and inference include the following:

•    Rows and columns: Check rows and columns to ensure no missing values or incorrect patterns are found.

•    Individual values: Check individual values if they fall within the range or have missing values to ensure the correctness of the data.

•    Aggregated values: Check statistical aggregations for columns or groups within the data to understand the correspondence, coherence, and accuracy of the data.

2.   Model testing: The model should be tested both during training and after it has been trained to ensure that it is robust, scalable, and secure. The following are some aspects of model testing:

•    Check the shape of the model input (for the serialized or non-serialized model).

•    Check the shape and output of the model.

•    Behavioral testing (combinations of inputs and expected outputs).

•    Load serialized or packaged model artifacts into memory and deployment targets. This will ensure that the model is de-serialized properly and is ready to be served in the memory and deployment targets.

•    Evaluate the accuracy or key metrics of the ML model.

Integration testing

Integration testing is a process where individual software components are combined and tested as a group (for example, data processing or inference or CI/CD).

Figure 1: Integration testing (two modules)

Let’s look at a simple hypothetical example of performing integration testing for two components of the MLOps workflow. In the Build module, data ingestion and model training steps have individual functionalities, but when integrated, they perform ML model training using data ingested to the training step. By integrating both module 1 (data ingestion) and module 2 (model training), we can perform data loading tests (to see whether the ingested data is going to the model training step), input and outputs tests (to confirm that expected formats are inputted and outputted from each step), as well as any other tests that are use case-specific.

In general, integration testing can be done in two ways:

1.    Big Bang testing: An approach in which all the components or modules are integrated simultaneously and then tested as a unit.

2.    Incremental testing: Testing is carried out by merging two or more modules that are logically connected to one another and then testing the application's functionality. Incremental tests are conducted in three ways:

•    Top-down approach

•    Bottom-up approach

•    Sandwich approach: a combination of top-down and bottom-up

Figure 2: Integration testing (incremental testing)

The top-down testing approach is a way of doing integration testing from the top to the bottom of the control flow of a software system. Higher-level modules are tested first, and then lower-level modules are evaluated and merged to ensure software operation. Stubs are used to test modules that aren't yet ready. The advantages of a top-down strategy include the ability to get an early prototype, test essential modules on a high-priority basis, and uncover and correct serious defects sooner. One downside is that it necessitates a large number of stubs, and lower-level components may be insufficiently tested in some cases.

The bottom-up testing approach tests the lower-level modules first. The modules that have been tested are then used to assist in the testing of higher-level modules. This procedure is continued until all top-level modules have been thoroughly evaluated. When the lower-level modules have been tested and integrated, the next level of modules is created. With the bottom-up technique, you don’t have to wait for all the modules to be built. One downside is those essential modules (at the top level of the software architecture) that impact the program's flow are tested last and are thus more likely to have defects.
The sandwich testing approach tests top-level modules alongside lower-level modules, while lower-level components are merged with top-level modules and evaluated as a system. This is termed hybrid integration testing because it combines top-down and bottom-up methodologies.

Learn more

For further details and to learn about hands-on implementation, check out the Engineering MLOps book, or learn how to build and deploy a model in Azure Machine Learning using MLOps in the “Get Time to Value with MLOps Best Practices” on-demand webinar. Also, check out our recently announced blog about solution accelerators (MLOps v2) to simplify your MLOps workstream in Azure Machine Learning.
Quelle: Azure

Top Tips and Use Cases for Managing Your Volumes

The architecture of a container includes its application layer, data layer, and local storage within the containerized image. Data is critical to helping your apps run effectively and serving content to users.
Running containers also produce files that must exist beyond their own lifecycles. Occasionally, it’s necessary to share these files between your containers — since applications need continued access to things like user-generated content, database content, and log files. While you can use the underlying host filesystem, it’s better to use Docker volumes as persistent storage.
A Docker volume represents a directory on the underlying host, and is a standalone storage volume managed by the Docker runtime. One advantage of volumes is that you don’t have to specify a persistent storage location. This happens automatically within Docker and is hands-off. The primary purpose of Docker volumes is to provide named persistent storage across hosts and platforms.
This article covers how to leverage volumes, some quick Docker Desktop volume-management tips, and common use cases you may find helpful. Let’s jump in.
Working with Volumes
You can do the following to interact with Docker volumes:

Specify the -v (–volume) parameter in your docker run command. If the volume doesn’t exist yet, this creates it.
Include the volumes parameter in a Docker Compose file.
Run docker volume create to have more control in the creation step of a volume, after which you can mount it on one or more containers.
Run docker volume ls to view the different Docker volumes available on a host.
Run docker volume rm <volumename> to remove the persistent volume.
Run docker volume inspect <volumename> to view a volume’s configurations.

 
While the CLI is useful, you can also use Docker Desktop to easily create and manage volumes. Volume management has been one of the significant updates in Docker Desktop since v3.5, which we previously announced on our blog.
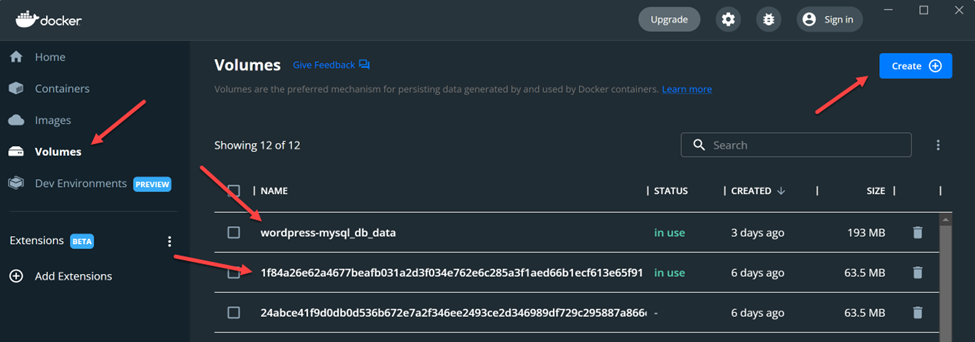
The following screenshots show the Volumes interface within Docker Desktop:


With Docker Desktop, you can do the following:

Create new volumes with the click of a button.
View important details about each volume (name, status, modification date, and size).
Delete volumes as needed.
Browse a volume’s contents directly through the interface.


Quick Tips for Easier Volume Management
Getting the most out of Docker Desktop means familiarizing yourself with some handy processes. Let’s explore some quick tips for managing Docker volumes.
Remove Unneeded Volumes to Save Space
Viewing each volume’s size within Docker Desktop is easy. Locate the size column and sort accordingly to view which volumes are consuming the most space. Volume removal isn’t automatic, so you need to manage this process yourself.
Simply find the volume you want to remove from your list, select it, and click either the trash can icon on the right or the red “Delete” button that appears above that list. This is great for saving local disk space. The process takes seconds, and Docker Desktop will save you from inadvertently removing active volumes — something best suited for the docker volume -f <volumename> command.
Leverage Batch Volume Selection
With Docker Desktop v4.7+, you can select multiple inactive volumes and delete them simultaneously. Alternatively, you can still use the docker volume prune CLI command to do this.
Ensure that your volumes are safe to delete, since they might contain crucial data. There’s currently no way to recover data from deleted or pruned volumes. It’s easier to erase critical application data while juggling multiple volumes, so exercise a little more caution with this CLI command.


Manage Data Within Volumes
You can also delete specific data within a volume or extract data from a volume (and save it) to use it externally. Use the three-dot menu to the right of a file item to delete or save your data. You can also easily view your volume’s collection of stored files in a familiar list format — helping you understand where important data and application dependencies reside.


Common and Clever Use Cases
Persisting Data with Named Volumes
The primary reason for using or switching to named volumes over bind mounts (which require you to manage the source location) is storage simplification. You might not care where your files are stored, and instead just need them reliably persisted across restarts.
And while you could once make a performance argument for named volumes on Linux or macOS, this is no longer the case following Docker Desktop’s v4.6 release.
There are a few other areas where named volumes are ideal, including:

Larger, static dependency trees and libraries
Database scenarios such as MySQL, MariaDB, and SQLite
Log file preservation and adding caching directories
Sharing files between different containers

 
Named volumes also give you a chance to semantically describe your storage, which is considered a best practice even if it’s not required. These identifiers can help you keep things organized — either visually, or more easily via CLI commands. After all, a specific name is much easier to remember than a randomized alphanumeric string (if you can remember those complex strings at all).
Better Testing and Security with Read-only Volumes
In most cases, you’ll want to provide a read and write storage endpoint for your running, containerized workloads. However, read-only volumes do have their perks. For example, you might have a test scenario where you want an application to access a data back end without overwriting the actual data.
Additionally, there might be a security scenario wherein read-only data volumes reduce tampering. While an attacker could gain access to your files, there’s nothing they could do to alter the filesystem.
You could even run into a niche scenario where you’re spinning up a server application — which requires read-write access — yet don’t need to persist your data between container runs. NGINX and Apache might particularly require write permissions for crucial PID or lock files. You can still leverage read-only volumes. Simply add the –tmpfs flag to denote a destination filesystem location.
Docker lets you define any volume as read-only using the :ro option, shown below:
docker run -v demovolume:/containerpath:ro my/demovolume
Tapping into Cloud Storage
Local storage is great, but your application may rely on cloud-based data sharing to run effectively. AWS and Azure are popular platforms, and it’s understandable that you’ll want to leverage them within your builds.
You can set up persistent cloud storage drivers, for Docker for AWS and Docker for Azure, using Docker’s Cloudstor plugin. This helps you get up and running with cloud-centric volumes after installation via the CLI. You can read more about setting up Cloudstor, and even starting a companion NGINX service, here.
What about shared object storage? You can also create volumes with a driver that supports writing files externally to NFS or Amazon S3. You can store your most important data in the cloud without grappling with application logic, saving time and effort.
Sharing Volumes Using Docker Compose
Since you can share Docker volumes among containers, they’re the perfect solution in a Docker Compose scenario. Each assigned container can have a volume parameter or you can share a volume among containers.
A Docker Compose file with volumes looks like this:

services:
db:
# We use a mariadb image which supports both amd64 & arm64 architecture
#image: mariadb:10.6.4-focal
# If you really want to use MySQL, uncomment the following line
image: mysql:8.0.27
command: ‘–default-authentication-plugin=mysql_native_password’
volumes:
– db_data:/var/lib/mysql
restart: always
environment:
– MYSQL_ROOT_PASSWORD=P@55W.RD123
– MYSQL_DATABASE=wordpress
– MYSQL_USER=wordpress
– MYSQL_PASSWORD=P@55W.RD123
expose:
– 3306
– 33060
wordpress:
image: wordpress:latest
ports:
– 80:80
restart: always
environment:
– WORDPRESS_DB_HOST=db
– WORDPRESS_DB_USER=wordpress
– WORDPRESS_DB_PASSWORD=P@55W.RD123
– WORDPRESS_DB_NAME=wordpress
volumes:
db_data:

 
This code creates a volume named db_data and mounts it at /var/lib/mysql within the db container. When the MySQL container runs, it’ll store its files in this directory and persist them between container restarts.
Check out our documentation on using volumes to learn more about Docker volumes and how to manage them.
Conclusion
Docker volumes are convenient file-storage solutions for Docker container runtimes. They’re also the recommended way to concurrently share data among multiple containers. Given the fact that Docker volumes are persistent, they enable the storage and backup of critical data. They also enable storage centralization between containers.
We’ve also explored working with volumes, powerful use cases, and the volume-management benefits that Docker Desktop provides aside from the CLI.
Download Docker Desktop to get started with easier volume management. However, our volume management features (and use cases) are always evolving! To stay current with Docker Desktop’s latest releases, remember to bookmark our evolving changelog.
Quelle: https://blog.docker.com/feed/

Docker Hub v1 API Deprecation

Docker has planned to deprecate the Docker Hub v1 API endpoints that access information related to Docker Hub repositories on September 5th, 2022.
Context
At this time, we have found that the number of v1 API consumers on Docker Hub has fallen below a reasonable threshold to maintain this version of the Hub API. Additionally, approximately 95% of Hub API requests target the newer v2 API. This decision has been made to ensure the stability and enhanced performance of our services so that we can continue to provide you with the best developer experience.
How does this impact you?
After the 5th of September, the following API routes within the v1 path will no longer work and will return a 404 status code:

/v1/repositories/<name>/images
/v1/repositories/<name>/tags
/v1/repositories/<name>/tags/<tag_name>
/v1/repositories/<namespace>/<name>/images
/v1/repositories/<namespace>/<name>/tags
/v1/repositories/<namespace>/<name>/tags/<tag_name>

If you want to continue using the Docker Hub API in your current applications, you must update your clients to use the v2 endpoints. Additional documentation and technical details about how to use the v2 API are available at the following URL: https://docs.docker.com/docker-hub/api/latest/
How do you get additional help?
If you have additional questions or concerns about the Hub v1 API deprecation process, you can contact us at v1-api-deprecation@docker.com.
Quelle: https://blog.docker.com/feed/

Amazon EC2 VT1 unterstützt jetzt das AMD-Xilinx Video SDK 2.0, das GStreamer und 10-Bit-Videotranskodierung ermöglicht

Wir freuen uns, ankündigen zu können, dass Amazon EC2 VT1-Instances jetzt das AMD-Xilinx Video SDK 2.0 unterstützen, das Unterstützung für Gstreamer, 10-Bit-HDR-Video und dynamische Enkodiererparameter einführt. Neben den neuen Funktionen bietet die neue Version eine verbesserte Bildqualität für 4K-Video, Unterstützung einer neueren FFmpeg-Version (4.4), erweiterte Betriebssystem-/Kernelunterstützung und Fehlerbehebungen.
Quelle: aws.amazon.com

Passen Sie bei der Verwendung von Amazon Lookout für Metrics leicht Ihre Benachrichtigungen an

Wir freuen uns, ankündigen zu können, dass Sie nun Filter zu Alarmen hinzufügen und bestehende Alarme bearbeiten können, wenn Sie Amazon Lookout für Metrics verwenden. Mit diesem Launch können Sie jetzt Filter zu Ihrer Alarmkonfiguration hinzufügen, um Benachrichtigungen für Anomalien zu erhalten, die für Sie am wichtigsten sind. Außerdem können Sie leicht je nach Bedarf bestehende Alarme bearbeiten, wenn sich Anomalien verändern.
Quelle: aws.amazon.com

AWS Recyle Bin für EBS Snapshots und EBS-gestützte AMIs unterstützt jetzt IAM-Bedingungsschlüssel zur Verwaltung von Aufbewahrungsrichtlinien

Sie können jetzt Bedingungsschlüssel in Identity and Access Management (IAM) verwenden, um anzugeben, welche Ressourcentypen in den für Recycle Bin erstellten Aufbewahrungsrichtlinien zulässig sind. Mit Recycle Bin können Sie gelöschte EBS-Snapshots und EBS-gestützte AMIs für einen bestimmten Zeitraum beibehalten, damit Sie sie im Falle einer versehentlichen Löschung wiederherstellen können. Sie können den Papierkorb für all oder für einen Teil Ihrer Snapshots oder AMIs auf Ihrem Konto durch die Erstellung einer oder mehrerer Aufbewahrungsrichtlinien aktivieren. Jede Regel gibt auch einen Aufbewahrungszeitraum vor. Ein gelöschter EBS-Snapshot oder ein deregistriertes AMI können aus dem Papierkorb wiederhergestellt werden, bis der Aufbewahrungszeitraum überschritten wurde.
Quelle: aws.amazon.com