“Operating a cloud infrastructure at global scale is a large and complex task, particularly when it comes to service standard and quality. In a previous blog, we shared how AIOps was leveraged to improve service quality, engineering efficiency, and customer experience. In this blog, I’ve asked Jian Zhang, Principal Program Manager from the AIOps Platform and Experiences team to share how AI and machine learning is used to automate memory leak detection, diagnosis, and mitigation for service quality.”—Mark Russinovich, Chief Technology Officer, Azure.
In the ever-evolving landscape of cloud computing, memory leaks represent a persistent challenge—affecting performance, stability, and ultimately, the user experience. Therefore, memory leak detection is important to cloud service quality. Memory leaks happen when memory is allocated but not released in a timely manner unintentionally. It causes potential performance degradation of the component and possible crashes of the operation system (OS). Even worse, it often affects other processes running on the same machine, causing them to be slowed down or even killed.
Given the impact of memory leak issues, there are many studies and solutions for memory leak detection. Traditional detection solutions fall into two categories: static and dynamic detection. The static leak detection techniques analyze software source code and deduce potential leaks whereas the dynamic method detects leak through instrumenting a program and tracks the object references at runtime.
However, these conventional techniques for detecting memory leaks are not adequate to meet the needs of leak detection in a cloud environment. The static approaches have limited accuracy and scalability, especially for leaks that result from cross-component contract violations, which need rich domain knowledge to capture statically. In general, the dynamic approaches are more suitable for a cloud environment. However, they are intrusive and require extensive instrumentations. Furthermore, they introduce high runtime overhead which is costly for cloud services.
RESIN
Designed to address memory leaks in production cloud infrastructure
Explore the research
Introducing RESIN
Today, we are introducing RESIN, an end-to-end memory leak detection service designed to holistically address memory leaks in large cloud infrastructure. RESIN has been used in Microsoft Azure production and demonstrated effective leak detection with high accuracy and low overhead.
REsin: a holistic service for memory leaks
Read the report
RESIN system workflow
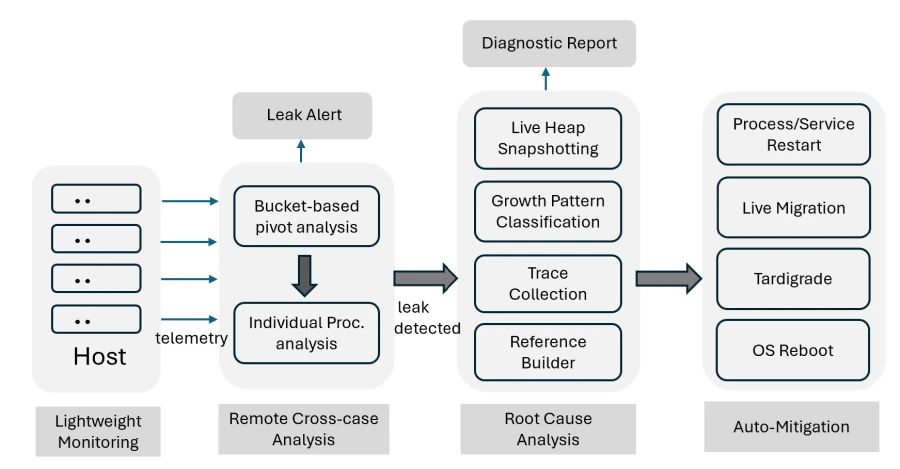
A large cloud infrastructure could consist of hundreds of software components owned by different teams. Prior to RESIN, memory leak detection was an individual team’s effort in Microsoft Azure. As shown in Figure 1, RESIN utilizes a centralized approach, which conducts leak detection in multi-stages for the benefit of low overhead, high accuracy, and scalability. This approach does not require access to components’ source code or extensive instrumentation or re-compilation.
Figure 1: RESIN workflow
RESIN conducts low-overhead monitoring using monitoring agents to collect memory telemetry data at host level. A remote service is used to aggregate and analyze data from different hosts using a bucketization-pivot scheme. When leaking is detected in a bucket, RESIN triggers an analysis on the process instances in the bucket. For highly suspicious leaks identified, RESIN performs live heap snapshotting and compares it to regular heap snapshots in a reference database. After generating multiple heap snapshots, RESIN runs diagnosis algorithm to localize the root cause of the leak and generates a diagnosis report to attach to the alert ticket to assist developers for further analysis—ultimately, RESIN automatically mitigates the leaking process.
Detection algorithms
There are unique challenges in memory leak detection in cloud infrastructure:
Noisy memory usage caused by changing workload and interference in the environment results in high noise in detection using static threshold-based approach.
Memory leak in production systems are usually fail-slow faults that could last days, weeks, or even months and it can be difficult to capture gradual change over long periods of time in a timely manner.
At the scale of Azure global cloud, it’s not practical to collect fine-grained data over long period of time.
To address these challenges, RESIN uses a two-level scheme to detect memory leak symptoms: A global bucket-based pivot analysis to identify suspicious components and a local individual process leak detection to identify leaking processes.
With the bucket-based pivot analysis at component level, we categorize raw memory usage into a number of buckets and transform the usage data into summary about number of hosts in each bucket. In addition, a severity score for each bucket is calculated based on the deviations and host count in the bucket. Anomaly detection is performed on the time-series data of each bucket of each component. The bucketization approach not only robustly represents the workload trend with noise tolerance but also reduces computational load of the anomaly detection.
However, detection at component level only is not sufficient for developers to investigate the leak efficiently because, normally, many processes run on a component. When a leaking bucket is identified at the component level, RESIN runs a second-level detection scheme at the process granularity to narrow down the scope of investigation. It outputs the suspected leaking process, its start and end time, and the severity score.
Diagnosis of detected leaks
Once a memory leak is detected, RESIN takes a snapshot of live heap, which contains all memory allocations referenced by running application, and analyzes the snapshots to pinpoint the root cause of the detected leak. This makes memory leak alert actionable.
RESIN also leverages Windows heap manager’s snapshot capability to perform live profiling. However, the heap collection is expensive and could be intrusive to the host’s performance. To minimize overhead caused by heap collection, a few considerations are considered to decide how snapshots are taken.
The heap manager only stores limited information in each snapshot such as stack trace and size for each active allocation in each snapshot.
RESIN prioritizes candidate hosts for snapshotting based on leak severity, noise level, and customer impact. By default, the top three hosts in the suspected list are selected to ensure successful collection.
RESIN utilizes a long-term, trigger-based strategy to ensure the snapshots capture the complete leak. To facilitate the decision regarding when to stop the trace collection, RESIN analyzes memory growth patterns (such as steady, spike, or stair) and takes a pattern-based approach to decide the trace completion triggers.
RESIN uses a periodical fingerprinting process to build reference snapshots, which is compared with the snapshot of suspected leaking process to support diagnosis.
RESIN analyzes the collected snapshots to output stack traces of the root.
Mitigation of detected leaks
When a memory leak is detected, RESIN attempts to automatically mitigate the issue to avoid further customer impact. Depending on the nature of the leak, a few types of mitigation actions are taken to mitigate the issue. RESIN uses a rule-based decision tree to choose a mitigation action that minimizes the impact.
If the memory leak is localized to a single process or Windows service, RESIN attempts the lightest mitigation by simply restarting the process or the service. OS reboot can resolve software memory leaks but takes a much longer time and can cause virtual machine downtime and as such, is normally reserved as the last resort. For a non-empty host, RESIN utilizes solutions such as Project Tardigrade, which skips hardware initialization and only performs a kernel soft reboot, after live virtual machine migration, to minimize user impact. A full OS reboot is performed only when the soft reboot is ineffective.
RESIN stops applying mitigation actions to a target once the detection engine no longer considers the target leaking.
Result and impact of memory leak detection
RESIN has been running in production in Azure since late 2018 and to date, it has been used to monitor millions of host nodes and hundreds of host processes daily. Overall, we achieved 85% precision and 91% recall with RESIN memory leak detection,1 despite the rapidly growing scale of the cloud infrastructure monitored.
The end-to-end benefits brought by RESIN are clearly demonstrated by two key metrics:
Virtual machine unexpected reboots: the average number of reboots per one hundred thousand hosts per day due to low memory.
Virtual machine allocation error: the ratio of erroneous virtual machine allocation requests due to low memory.
Between September 2020 and December 2023, the virtual machine reboots were reduced by nearly 100 times, and allocation error rates were reduced by over 30 times. Furthermore, since 2020, no severe outages have been caused by Azure host memory leaks.1
Learn more about RESIN
You can improve the reliability and performance of your cloud infrastructure, and prevent issues caused by memory leaks through RESIN’s end-to-end memory leak detection capabilities designed to holistically address memory leaks in large cloud infrastructure. To learn more, read the publication.
1 RESIN: A Holistic Service for Dealing with Memory Leaks in Production Cloud Infrastructure, Chang Lou, Johns Hopkins University; Cong Chen, Microsoft Azure; Peng Huang, Johns Hopkins University; Yingnong Dang, Microsoft Azure; Si Qin, Microsoft Research; Xinsheng Yang, Meta; Xukun Li, Microsoft Azure; Qingwei Lin, Microsoft Research; Murali Chintalapati, Microsoft Azure, OSDI’22.
The post Advancing memory leak detection with AIOps—introducing RESIN appeared first on Azure Blog.
Quelle: Azure