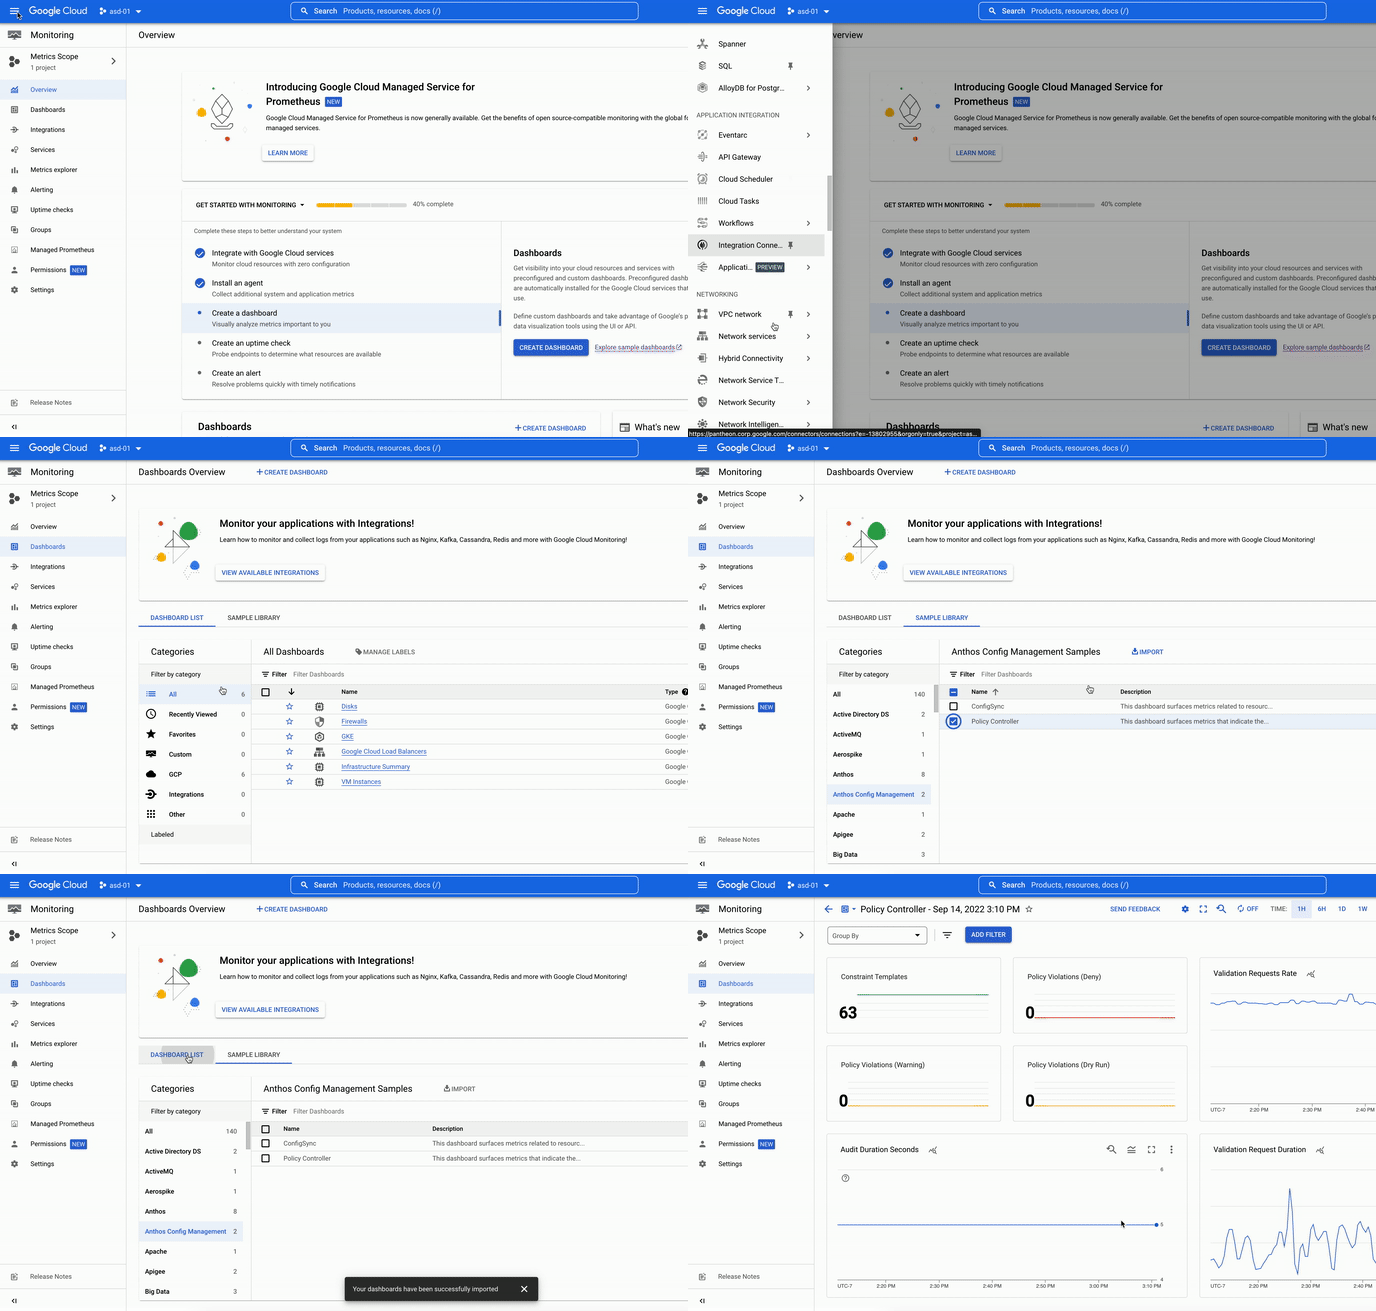
Policy Controller enables the enforcement of fully programmable policies for your clusters. These policies act as “guardrails” and prevent any changes from violating security, operational, or compliance controls at admission time, and post admission, using continuous audit.Through ongoing conversations with platform and security administrators, we have received feedback about increasing visibility into how the policies are applied i.e. enforced or audited across Anthos or GKE clusters.With the Anthos Config Management (ACM) 1.12.0 onwards, we have made it easier to export and visualize Policy Controller metrics.Policy Controller MetricsPolicy controller includes the metrics related to policy usage such as number of constraints, constraint templates, audit violations detected just to name a few (see list of metrics exposed).Exporting the metricsPolicy Controller uses OpenCensus to create and record metrics related to its processes and policy usage. Policy Controller can be easily configured to export these metrics to Prometheus and/or Cloud Monitoring at the install time. Default setting for exporting metrics for Policy controller will export the metrics to both Prometheus and Cloud monitoring. Viewing the metricsThese metrics are exported to the customer’s Cloud Monitoring project in Prometheus format. As a result, customers can view these metrics in the Cloud Monitoring UI or query them via the Cloud Monitoring API using either PromQL (the de-facto query language for Kubernetes metrics) or MQL (Google’s proprietary metrics query language). There is also a newly added cloud monitoring dashboard to view your metrics. This dashboard can be further edited to meet your business or operational needs. This dashboard can be imported from within Cloud Console.Login to Cloud Console and click on the hamburger (collapsed) menu and click on More Products to expand the list of products in the menu.Select Monitoring > Dashboards and then click the Sample Library tab on the page.This will show all the samples available by category.Select Anthos Config Management from the list.Check Policy Controller from the list and click Import.Confirm that you want to import the dashboard.This will create a new dashboard.You can view by clicking on the Dashboards menu item and then selecting the newly created Policy Controller dashboard from the list.PricingThese metrics are available at no additional cost to our customers. Alerting on the metricsYou can create alerting policies in Cloud Alertingso you are notified in case something needs your attention. Third Party integration Any third party observability tool can ingest these metrics using Cloud Monitoring API. If you are using Grafana dashboards all you have to do is point it to the Cloud Monitoring API for it to work. Next stepsInstall Policy Controller Implement CIS benchmark using Policy ControllerExplore Policy controller constraint template libraryConfig Sync metricsRelated ArticleExtending Anthos to manage on-premises edge VMs: now generally availableVM support in Anthos extends Anthos on bare metal (Google Distributed Cloud Virtual) to run and manage both containers and VMs on a singl…Read Article
Quelle: Google Cloud Platform

Published by