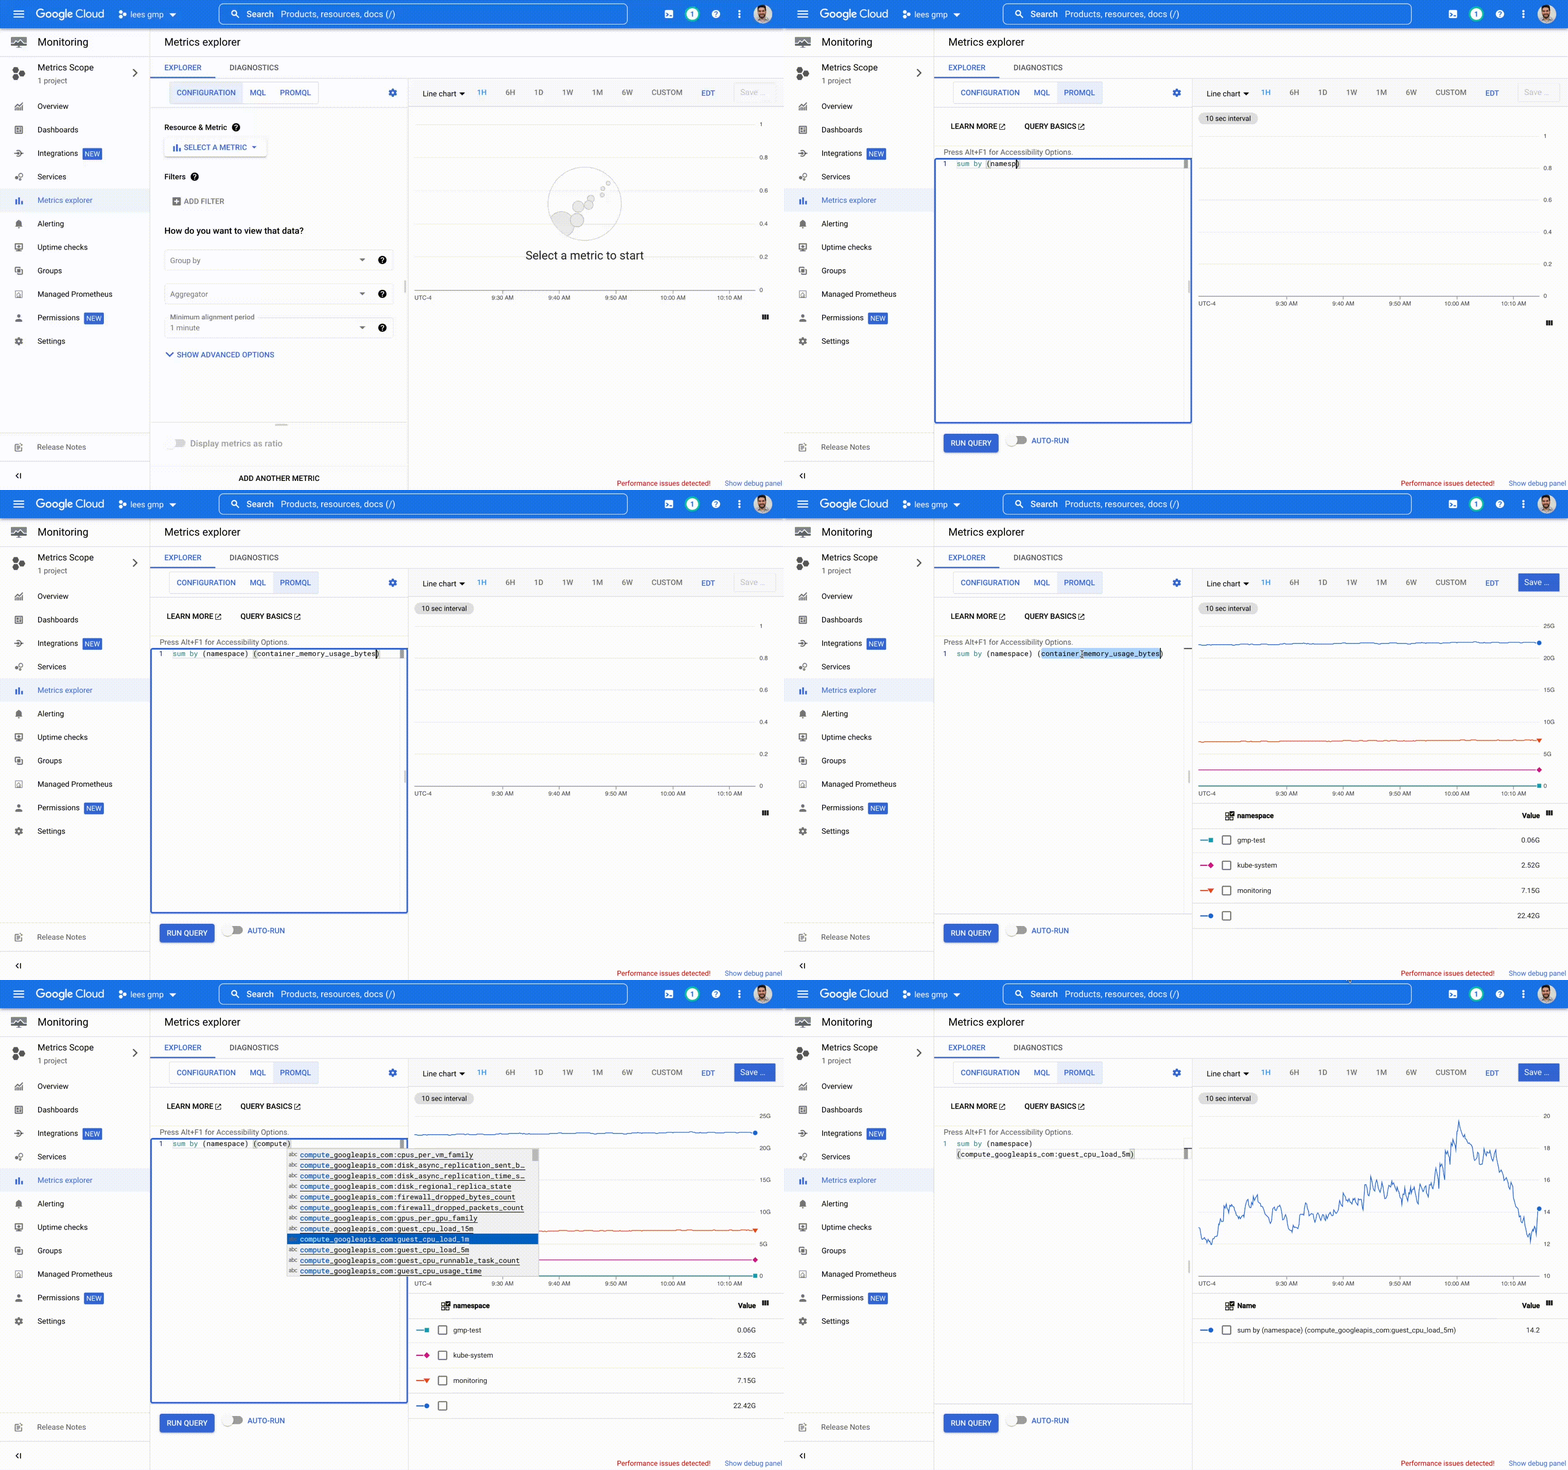
As Kubernetes monitoring continues to standardize on Prometheus as a form factor, more and more developers are becoming familiar with Prometheus’ built-in query language, PromQL. Besides being bundled with Prometheus, PromQL is popular for being a simple yet expressive language for querying time series data. It’s been fully adopted by the community, with lots of great query repositories, sample playbooks, and trainings for PromQL available online. It’s the query language that Kubernetes developers know and love.Introducing PromQL in the Google Cloud Monitoring user interfaceCloud Monitoring is committed to open source interfaces such as Prometheus, OpenCensus, and OpenTelemetry. We believe that having common standards across the industry improves ease of use for everybody and helps customers avoid lock-in due to provider-specific conventions. A few months ago, we doubled down on our commitment to open source interfaces by releasing PromQL for over 1,500 free metrics in Cloud Monitoring, usable through self-hosted Grafana. Today, we are excited to announce that you can now use PromQL throughout the Cloud Monitoring user interface, including in Metrics Explorer and Dashboard Builder.While using Grafana for Cloud Monitoring metrics will continue to be supported, we recognize that many customers prefer to use a Google-hosted, SLO-backed visualization and dashboarding tool instead of running their own. Now, developers don’t have to learn a new query language or paradigm to use Cloud Monitoring’s UI — they can keep using the same language they already know and love, and newly joined team members who already know PromQL can quickly become fluent with Cloud Monitoring.Cloud Monitoring’s PromQL comes with autocompletion of metric names, label keys, and label values. You can use PromQL to query free Google Cloud system metrics, Kubernetes metrics, log-based metrics, custom metrics, and Prometheus metrics, and you can use PromQL even if you don’t use Managed Service for Prometheus. PromQL in Cloud Monitoring is enabled by default, meaning that using PromQL or Managed Service for Prometheus no longer requires you to configure, run, or scale self-hosted Grafana. You can use both the Cloud Monitoring UI and Grafana, depending on which works best for any given use case.How to get startedThis product is in preview and open to all Google Cloud users. You can query Cloud Monitoring metrics with PromQL by using the PromQL tab in Metrics Explorer or the Dashboard Builder. PromQL-backed queries can be saved on your custom dashboards, and any dashboard chart can be opened in Metrics Explorer to perform ad hoc analysis using PromQL. To learn how to write PromQL for Google Cloud metrics, see PromQL for Cloud Monitoring metrics.To query Prometheus data alongside Cloud Monitoring metrics, you have to first get Prometheus data into the system. For instructions on configuring Managed Service for Prometheus ingestion, see Get started with managed collection.Related ArticleCloud Monitoring metrics, now in Managed Service for PrometheusQuery over 1,000 free Google Cloud metrics using PromQL. You can now view your Cloud Monitoring metrics alongside your Prometheus metrics.Read Article
Quelle: Google Cloud Platform

Published by