By Colt McAnlis, Developer Advocate
[Editor’s note: In the past couple of months, Colt McAnlis of Android Developers fame joined the Google Cloud developer advocate team. He jumped right in and started blogging — and vlogging — for the new Google Cloud Performance Atlas series, focused on extracting the best performance from your GCP assets. Check out this synopsis of his first video, where he tackles the problem of cold boot performance in App Engine standard environment. Vroom vroom!]
One of the fantastic features of App Engine standard environment is that it has load balancing built into it, and can spin up or spin down instances based upon traffic demands. This is great in situations where your content goes viral, or for daily ebb-and-flows of traffic, since you don’t have to spend time thinking about provisioning whatsoever.
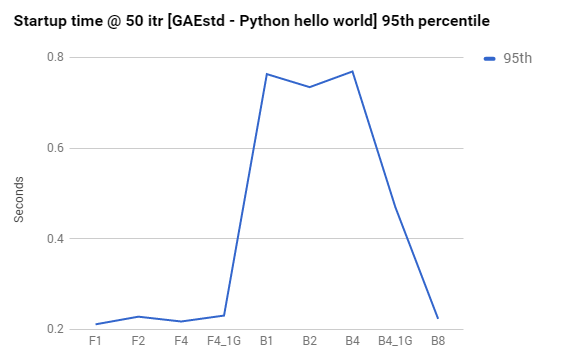
As a baseline, it’s easy to establish that App Engine startup time is really fast. The following graph charts instance type vs. startup time for a basic Hello World application:
250ms is pretty fast to boot up an App Engine F2 type instance class. That’s faster than fetching a Javascript file from most CDNs on a 4G connection, and shows that App Engine responds quickly to requests to create new instances.
There are great resources that detail how App Engine manages instances, but for our purposes, there’s one main concept we’re concerned with: loading requests.
A loading request triggers App Engine’s load balancer to spin up a new instance. This is important to note, since the response time for a loading request will be significantly higher than average, since the request must wait for the instance to boot up before it’s serviced.
As such, the key to being able to respond to rapid load balancing while keeping user experience high is to optimize the cold-boot performance of your App Engine application. Below, we’ve gathered a few suggestions on addressing the most common problems to cold-boot performance.
Leverage resident instances
Resident instances are instances that stick around regardless of the type of load your app is handling; even when you’ve scaled to zero, these instances will still be alive.
When spikes do occur, resident instances service requests that cannot be serviced in the time it would take to spin up a new instance; requests are routed to them while a new instance spins up. Once the new instance is up, traffic is routed to it and the resident instance goes back to being idle.
The point here is that resident instances are the key to rapid scale and not shooting users’ perception of latency through the roof. In effect, resident instances hide instance startup time from the user, which is a good thing!
For more information, check our our Cloud Performance Atlas article on how Resident instances helped a developer reduce their startup time.
Be careful with initializing global variables during parallel requests
While using global variables is a common programming practice, they can create a performance pitfall in certain scenarios relating to cold boot performance. If your global variable is initialized during the loading request AND you’ve got parallel requests enabled, your application can fall into a bit of a trap, where multiple parallel requests end up blocking, waiting on the first loading request to finish initializing of your global variable. You can see this effect in the logging snapshot below:
The very first request is our loading request, and the next batch is a set of blocked parallel requests, waiting for a global variable to initialize. You can see that these blocked requests can easily end up with 2x higher response latency, which is less than ideal.
For more info, check our our Cloud Performance Atlas article on how Global variables caused one developer a lot of headaches.
Be careful with dependencies
During cold-boot time, your application code is busy scanning and importing dependencies. The longer this takes, the longer it will take for your first line of code to execute. Some languages can optimize this process to be exceptionally fast, other languages are slower, but provide more flexibility.
And to be fair, most of the time, a standard application importing a few modules should have a negligible impact on performance. However, when third-party libraries get big enough, we start to see them do weird things with import semantics, which can mess up your boot time significantly.
Addressing dependency issues is no small feat. You might have to use warm-up requests, lazy-load your imports, or in the most extreme case, prune your dependency tree.
For more info, check our our Cloud Performance Atlas article on how the developer of a platypus-based calculator tracked down a dependency problem.
Every millisecond counts
In the end, optimizing cold-boot performance for App Engine instances is critical for scaling quickly and keeping user perception of latency in a good place. If you’d like to know more about ways to optimize your Google Cloud applications, check out the rest of the Google Cloud Performance Atlas blog posts and videos. Because when it comes to performance, every millisecond counts.
Quelle: Google Cloud Platform

Published by