Docker has a built-in stats command that makes it simple to see the amount of resources your containers are using. Just drop $ docker stats in your CLI and you’ll get a read out of the CPU, memory, network, and disk usage for all your running containers.
But this command only gives you a current moment in time. What if you wanted to see the evolution of the resources over time? Or see how much CPU and memory a Docker Compose project is using? Or sort containers by the most CPU-intensive, then filter by CPU usage over 80%?
With the Resource Usage extension, you can get a clearer view of your usage and the ability to analyze the data for better insights.
Let’s take a look at how it works.
How the Docker stats command works
Using Docker’s stats command, you get a live view of the resources used by your containers. Every running container can be analyzed using this tool to determine its CPU, memory, network, and disk utilization.
To use the command, open a terminal and run the docker stats command:
$ docker stats
CONTAINER CPU % MEM USAGE / LIMIT MEM % NET I/O BLOCK I/O
redis1 0.07% 796 KB / 64 MB 1.21% 788 B / 648 B 3.568 MB / 512 KB
redis2 0.07% 2.746 MB / 64 MB 4.29% 1.266 KB / 648 B 12.4 MB / 0 B
You can find out more about this command in the Docker documentation.
Docker stats is a useful command that provides information about the resources your containers are using at a given point in time. But that’s all it does. Before this extension, if you wanted to string together the information over a period of time, you were looking at a fairly manual process of pings and data consolidation.
Meet the Resource Usage extension
The Resource Usage extension shows which containers consume the most resources on their development machines by running the Docker stats command, then compiling the data into a user interface.
With the Resource Usage extension, you can quickly:
Analyze the most resource-intensive containers or Docker Compose projects.
Observe how resource usage changes over time for containers.
View how much CPU, memory, network, and disk space your containers use.
The cards at the top top of the extension give you a quick global overview of the resources in use:
CPU cores usage
Memory usage
# of running containers
The Table view shows the details for your containers. You can customize the view by selecting which columns you want to display and which values you want to filter. Here are the available columns:
NAME – The container name
STATUS – The container status (running or not running)
CPU (%) – The percentage of the host’s CPU and memory used by the container
MEM (%) – The amount of memory used out of the total limit it’s allowed to use
DISK READ/WRITE -The amount of data the container has read to and written from block devices on the host
NETWORK I/O – The amount of data the container has sent and received over its network interface
PIDs – the number of processes or threads the container has created
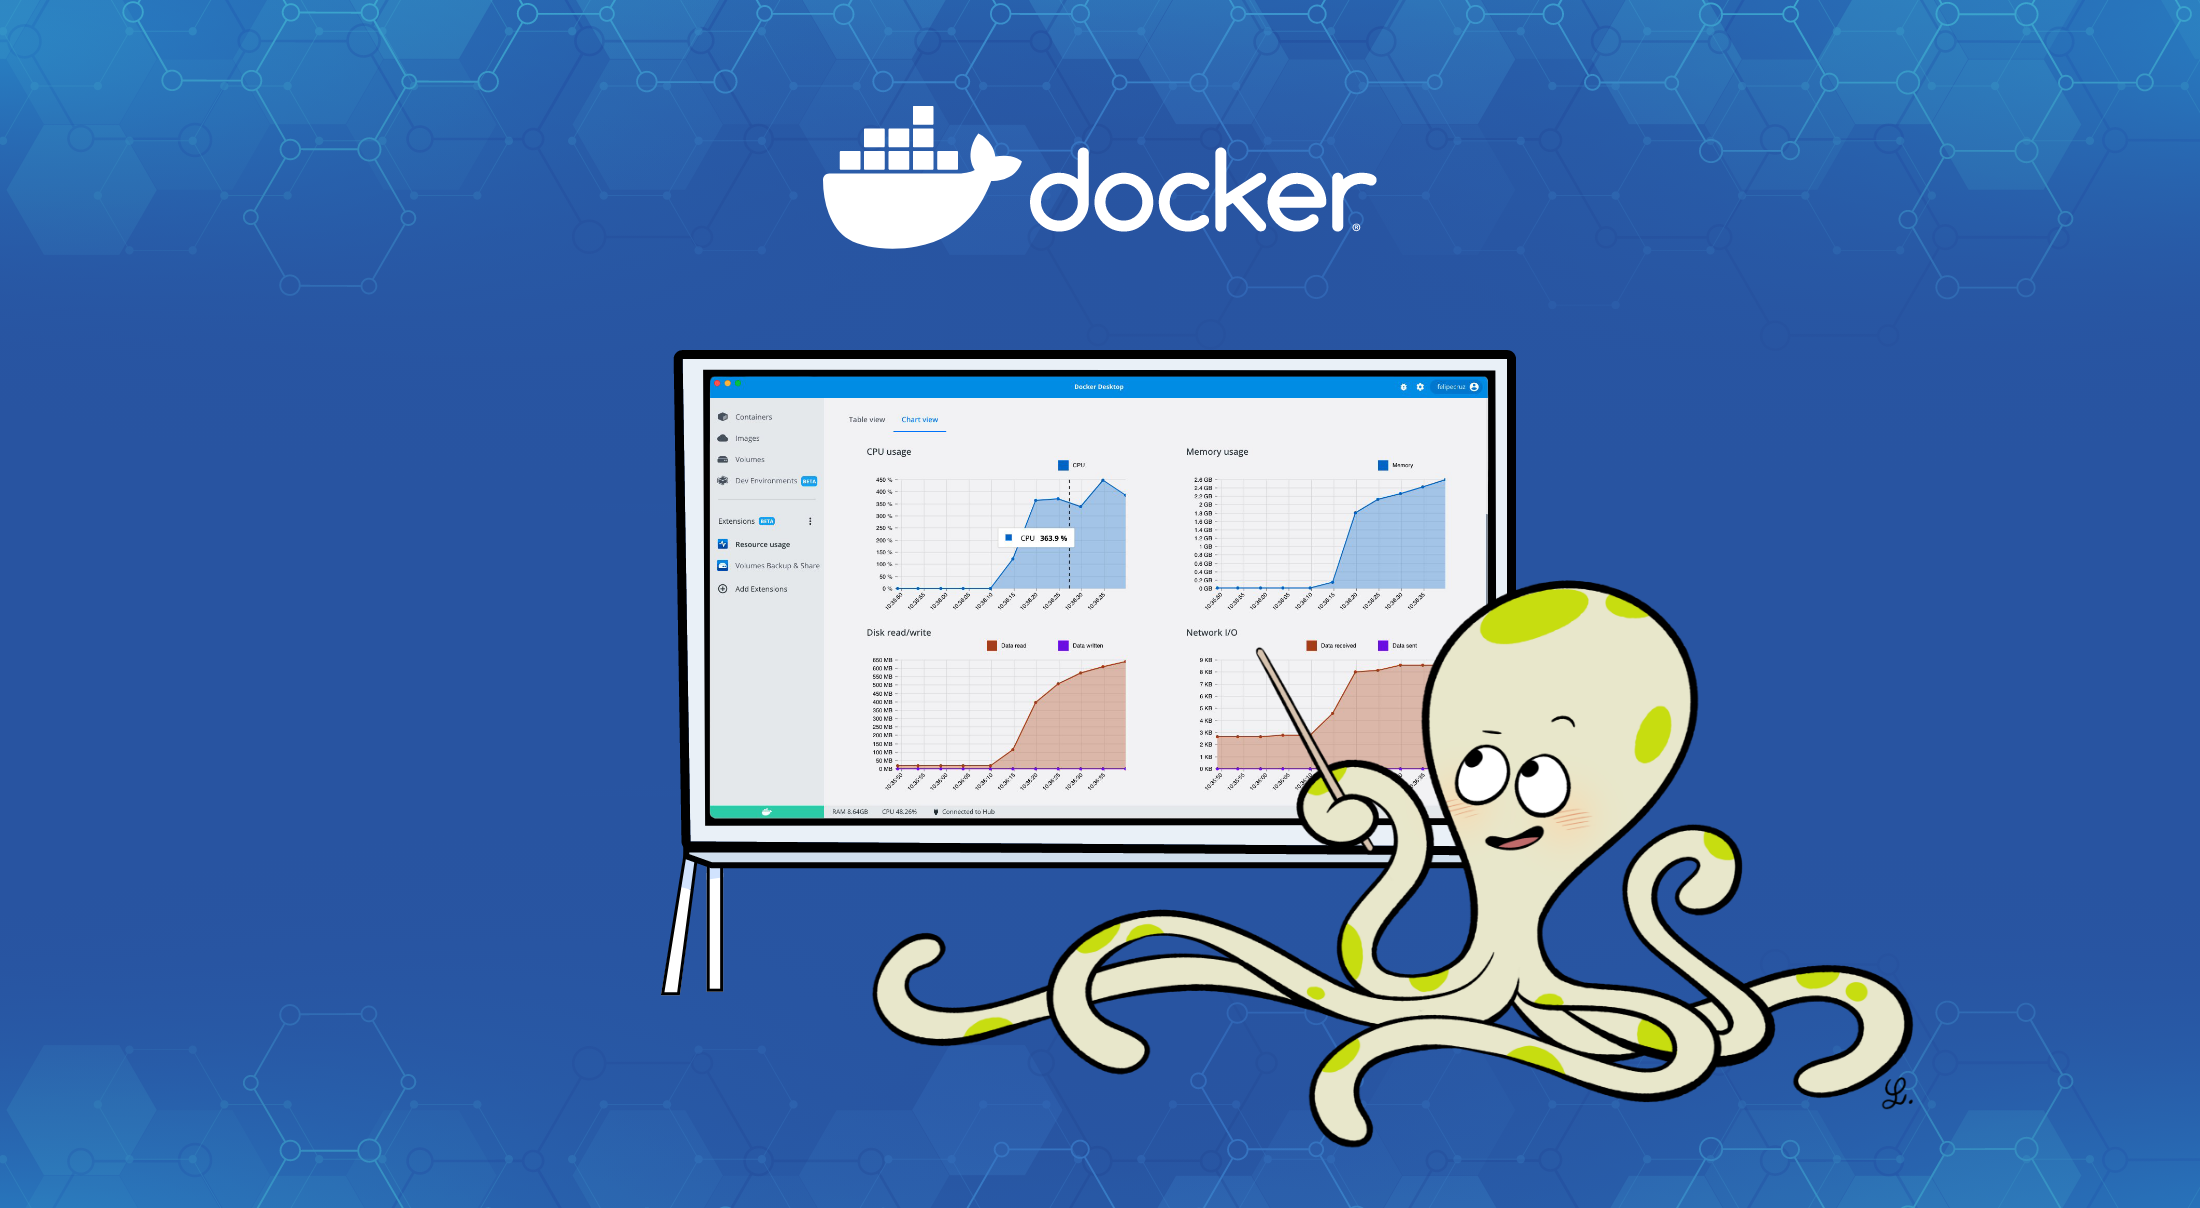
The Chart view provides a visual representation of usage over time.
How do I install the Resource Usage extension?
The Resource Usage extension is available on Docker Hub and under Extensions in Docker Desktop.
Let us know how you like it!
The Resource Usage extension helps you get powerful insights into how your containers are using resources so it’s easier and simpler to optimize your containers. Once you’ve tried it, we’d love to hear your feedback.
And if you haven’t tried Docker Extensions, explore the Extensions Marketplace and install a few! They expand your Docker Desktop capabilities with new tooling, like the ability to reclaim disk space used by Docker, explore logs, or backup, restore, and share volumes.
You can even create your own Docker Extensions for all OSes, including Windows, WSL2, macOS (both Intel and Apple Silicon), and Linux. Take a look at the official documentation for our Extensions SDK. You’ll find tutorials, design guidelines, and everything else you need to build an extension.
Once you’ve created an extension, if you’d like to share your extension with the Docker Community, submit it to the Extensions Marketplace.
Quelle: https://blog.docker.com/feed/

Published by