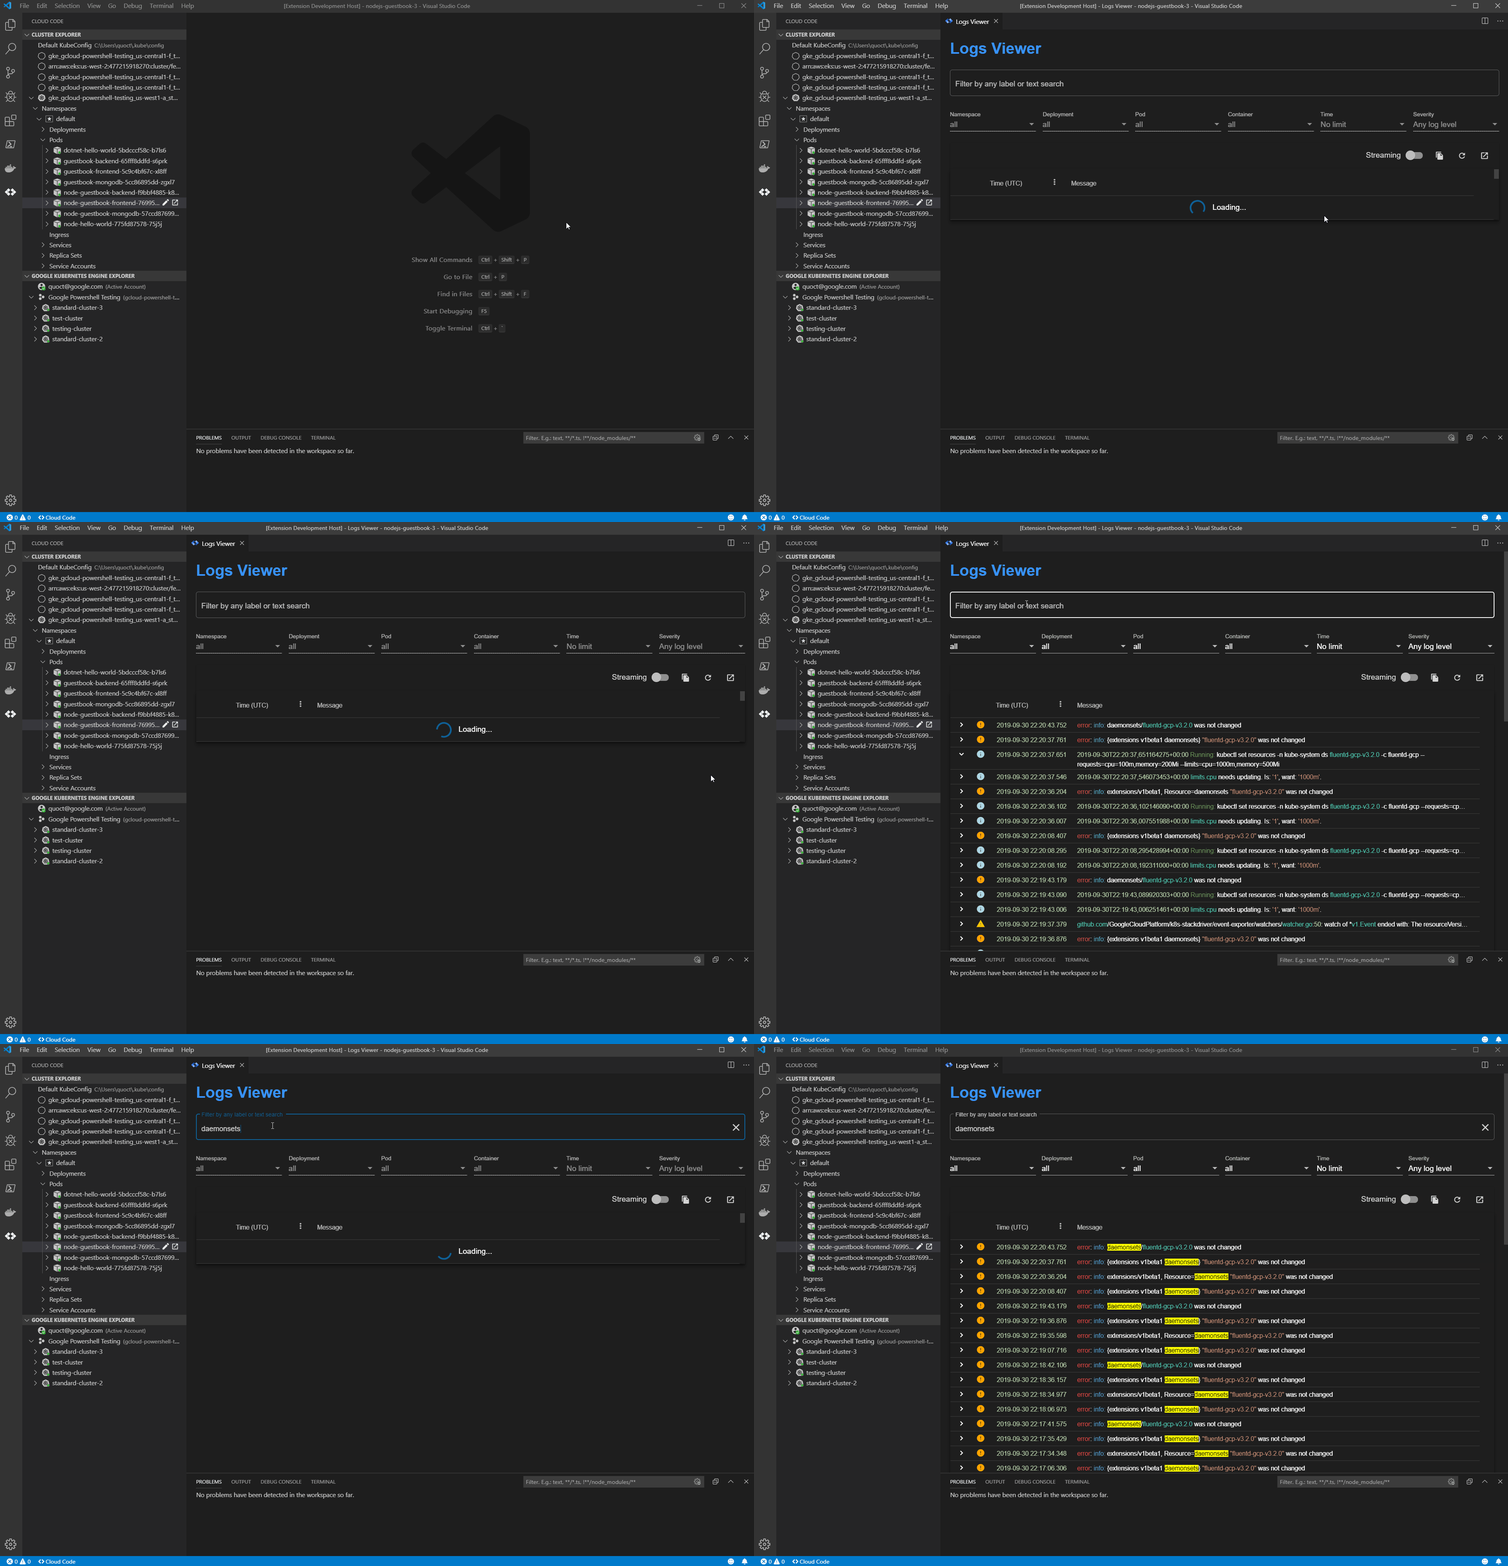
A big part of troubleshooting your code is inspecting the logs. At Google Cloud, we offer Cloud Code, a plugin to popular integrated development environments (IDEs) to help you write, deploy, and debug cloud-native applications quickly and easily. Stackdriver Logging, meanwhile, is the go-to tool for all Google Cloud Platform (GCP) logs, providing advanced searching and filtering as well as detailed information about them. But deciphering logs can be tedious. Even worse, you need to leave your IDE to access Stackdriver Logging. Now, with the Cloud Code plugin, you can access your Stackdriver logs in the Visual Studio Code IDE directly! The new Cloud Code logs viewer helps you simplify and streamline the diagnostics process with three new features:Integration with Stackdriver Logging A customizable logs viewerKubernetes-specific filtering View Stackdriver logs in VS CodeWith the new Cloud Code logs viewer you can access your Stackdriver logs in VS Code directly. Simply open the logs viewer and Cloud Code displays all your Stackdriver logs. You can edit the filters just like you do in Stackdriver, and if you would like to see more detailed information you can easily return to Stackdriver Logging from the IDE with your filters in place.In contrast to kubectl logs, Stackdriver logs are natively integrated with Google Cloud. Learn more about Stackdriver Logging here. Improved log exploration The new logs viewer provides a structured logs viewing experience that has several new features including: severity filters, colorized output, streaming capabilities, and timezone conversions. The new logs viewer presents an organized view of logs and lets you filter and search your logs from within VS Code. Think of the logs viewer as your first stop for all of your logs without having to leave your IDE. The logs viewer will supports kubectl logs.Kubernetes-specific filtering Kubernetes logs are complex. The new logs viewer lets you filter on Kubernetes-specific elements including: namespace, deployment, pod, container, and keyword. This allows you to easily see logs for specific pod or all the logs from a given deployment, helping you so you can navigate complex logs more effectively.In addition to manual filtering, you can access the logs viewer from the Cloud Code resource browser and use the tree view to filter your logs. This way, you can locate a resource with the context around it. The tree view shows status and context information that can help you find important logs such as unhealthy or orphaned pods.Get started Accessing Stackdriver Logs in VS Code with Cloud Code brings your logs closer to your code, with advanced filtering options that help you stay focused and in your IDE. To learn more, check out this guide to getting started with the Log Viewer. If you are new to Cloud Code or Stackdriver Logging, start by learning how to install Cloud Code and set up Stackdriver. If you are already using Cloud Code and Stackdriver Logging, there are no prerequisites to get started—just open the new logs viewer with Cloud Code and you’re ready to go!
Quelle: Google Cloud Platform

Published by