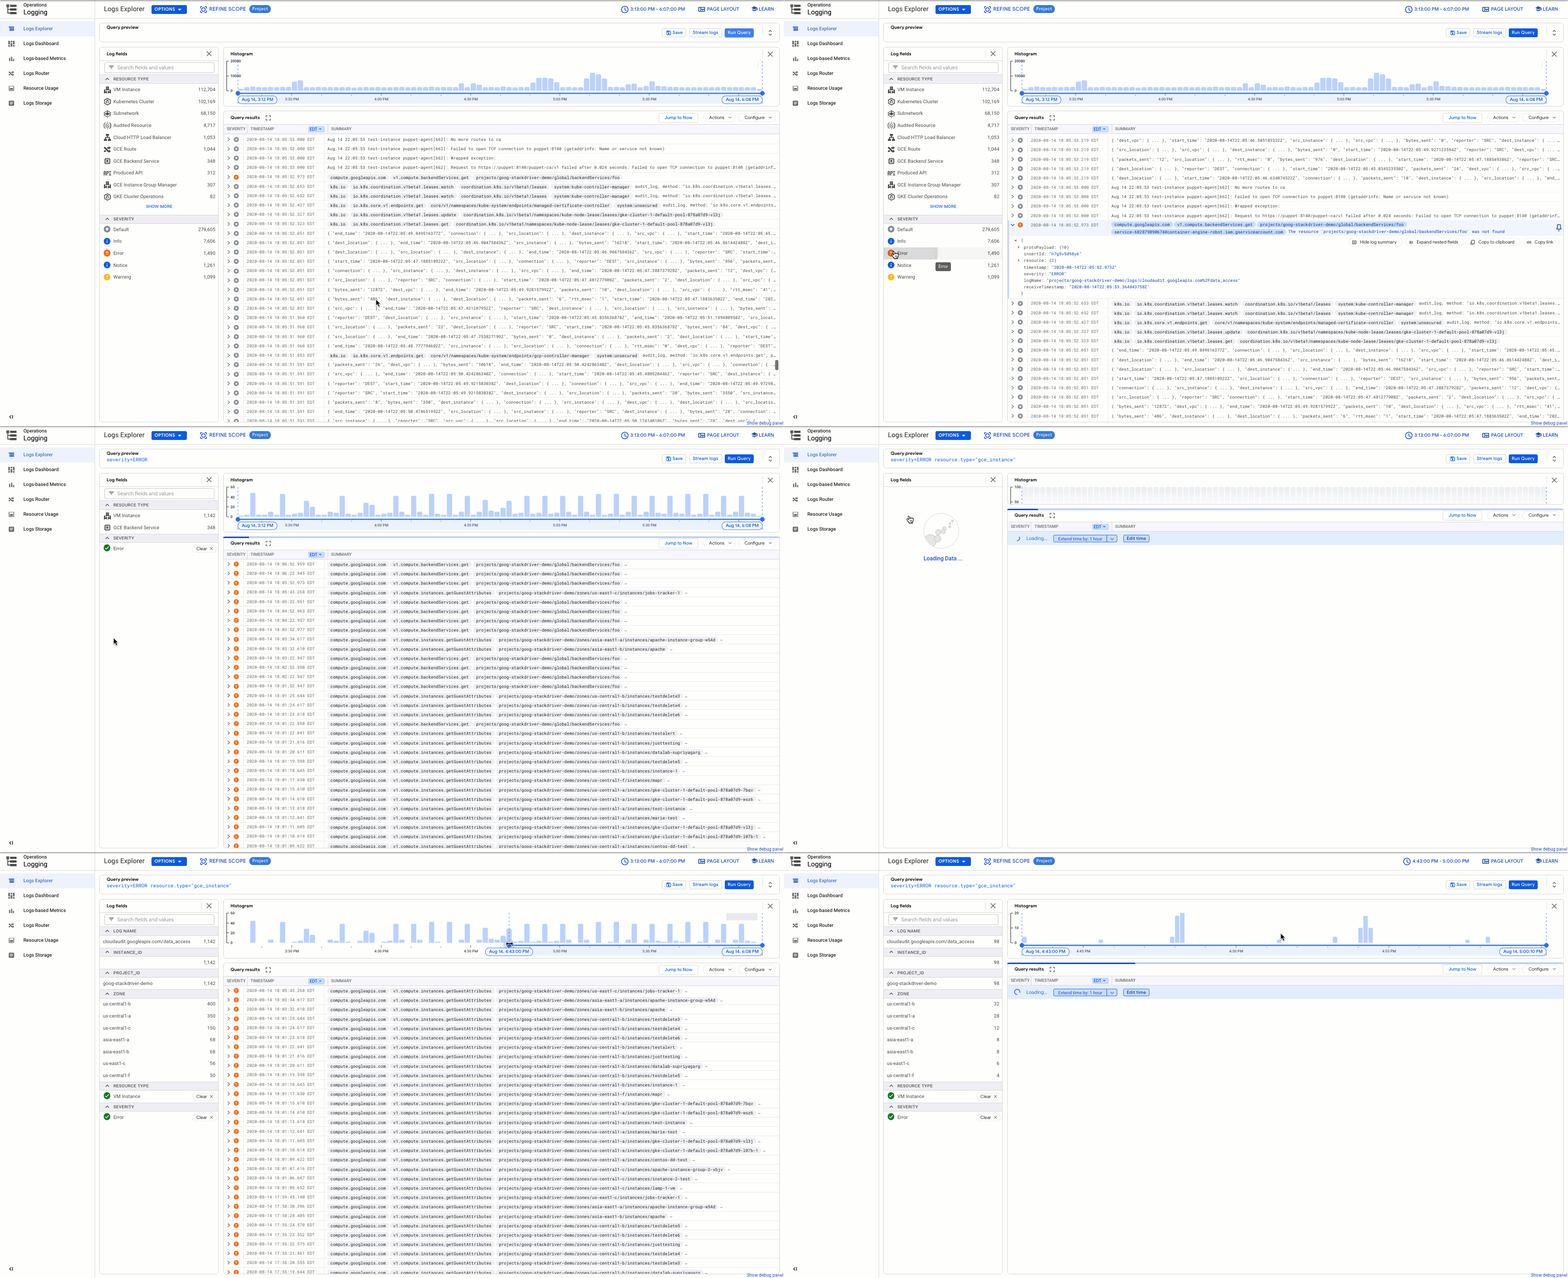
In Cloud Logging, we understand that logging is a critical part of what it takes for you to operate reliable applications and infrastructure on Google Cloud. We’ve added new features to help you more easily store, find and control your logs.Today, we’re announcing a new default logging experience: Logs Explorer. Previously known as Logs Viewer Preview, Logs Explorer provides new tools for you to better understand and analyze your logs during the troubleshooting process. We’re not getting rid of the classic Logs Viewer though—you can now access it as Legacy Viewer, and it will remain available as we add new features to Logs Explorer.In addition to a new name, Logs Explorer includes new features designed to reduce the time you spend analyzing logs as you troubleshoot code, and to improve visibility into your Google Cloud environment.Interactive queries with Log FieldsLog Fields provides a summary of your logs and insights into your next query. Log Fields include relevant metadata including resource type, severity, log name and service-specific information such as cluster name for Google Kubernetes Engine (GKE) or Cloud Function name. For example, you can answer questions like “What services are actively generating logs in my project?” or “Do I have a lot of errors in my logs and if so, which service is generating the errors?” The Log fields component can also adjust your query because every time you click a field value, the value is added to the query, which narrows the displayed results accordingly.Find anomalies with histograms Using the histogram view, you can analyze log volume over time. The histogram reflects the results returned from each query and can help you detect anomalies in your logs over time. When you’re troubleshooting, histograms can help you spot spikes in errors or drop-offs in your request log volume. Using the histogram, you can refine the query and narrow the result set to the time range you selected.Monitor your logs with the Logs DashboardDashboards help you make sense of what’s happening in your environment. Using the Logs Dashboard, you can review log distribution over time, broken by severity for the top resource types in your project.Each row of charts in the dashboard includes one resource type. The right-hand charts display the distribution of all the logs produced by the resource while the left-hand charts display the breakdown of errors. To query for the logs described in the chart, you can click on any of the bars in the chart and drill down to the logs. Using the logs dashboard is another quick way to find your logs.Gain new insights with Suggested Queries and Query LibraryThe query library makes it easier for you to find logs without building the same query or saving your favorite queries in a personal document or site. With the query library, you to can view and run queries in four ways:Recent queries – View and (re)run queries that you ran in the past.Saved queries – Save queries for future reference and then when you need them again, you can view and run, or edit and run those queries.Shared queries – Collaborate and share queries with other users in your project.Suggested queries – View and run queries automatically suggested for you by Cloud Logging based on your logs.Search across your logs with Logs BucketsUsing Logs Buckets and Log Views, you can centralize or subdivide logs based on your needs and set the appropriate access permissions. You can use Log Views to set IAM permissions to control who views which logs in a specific Log Bucket. Check out this recent blog post to learn more about four common use cases for log buckets including centralizing all your logs for your organization in a single project in Cloud Logging, and decentralizing your GKE multi-tenant cluster logs into separate projects/log buckets. View organization and folder-level logsYou apply organizational policies and other policies and services at different points within the resource hierarchy. You can now find these logs in the Logs Explorer, which makes it easier to understand what’s happening in your organization. For example, by selecting your organization from the project/organization drop-down, you can understand what IAM and organization policies have been added to your organization by viewing the SetIamPolicy and SetOrgPolicy audit logs.Learn more about Cloud LoggingIf you haven’t already, get started with the Log Explorer, learn more about Cloud Logging with our new qwiklab and join the discussion on our mailing list. Also, be sure to watch our Cloud Operations Spotlight session at Next OnAir. As always, we welcome your feedback.
Quelle: Google Cloud Platform


Published by